For the complete documentation index, see llms.txt. This page is also available as Markdown.

Cap Pricer

Price interest rate caps with scenario analysis, caplet breakdowns, and a strike/tenor price grid.

The Cap Pricer generates indicative cap pricing with scenario analysis, so you can compare capping vs fixing vs staying floating.


1. Enter Your Loan Details

  • Go to Cap Pricer

  • Fill in the Loan Details panel on the left:

    1. Reference Rate -- the floating rate index your loan is linked to (e.g., SOFR, SONIA, 6M EURIBOR).

    2. Notional -- the principal amount of the loan.

    3. Tenor (years) -- remaining term of the loan.

    4. Frequency -- how often the loan resets (Quarterly, Monthly, or Semi-Annual). Each reset becomes a caplet.


2. Set the Cap Strike and Margin

Below the loan details, enter:

  • Strike (%) -- the rate ceiling. If the reference rate rises above this, the cap pays the difference.

  • Margin (%) -- the spread your lender charges above the reference rate (e.g., SOFR + 1.50%). This is included in the scenario analysis.

  • Amortisation (%) -- annual amortisation rate if the loan amortises. Set to 0 for bullet.

Click Price Cap to calculate.


3. Reading the Results

The results panel shows several sections:

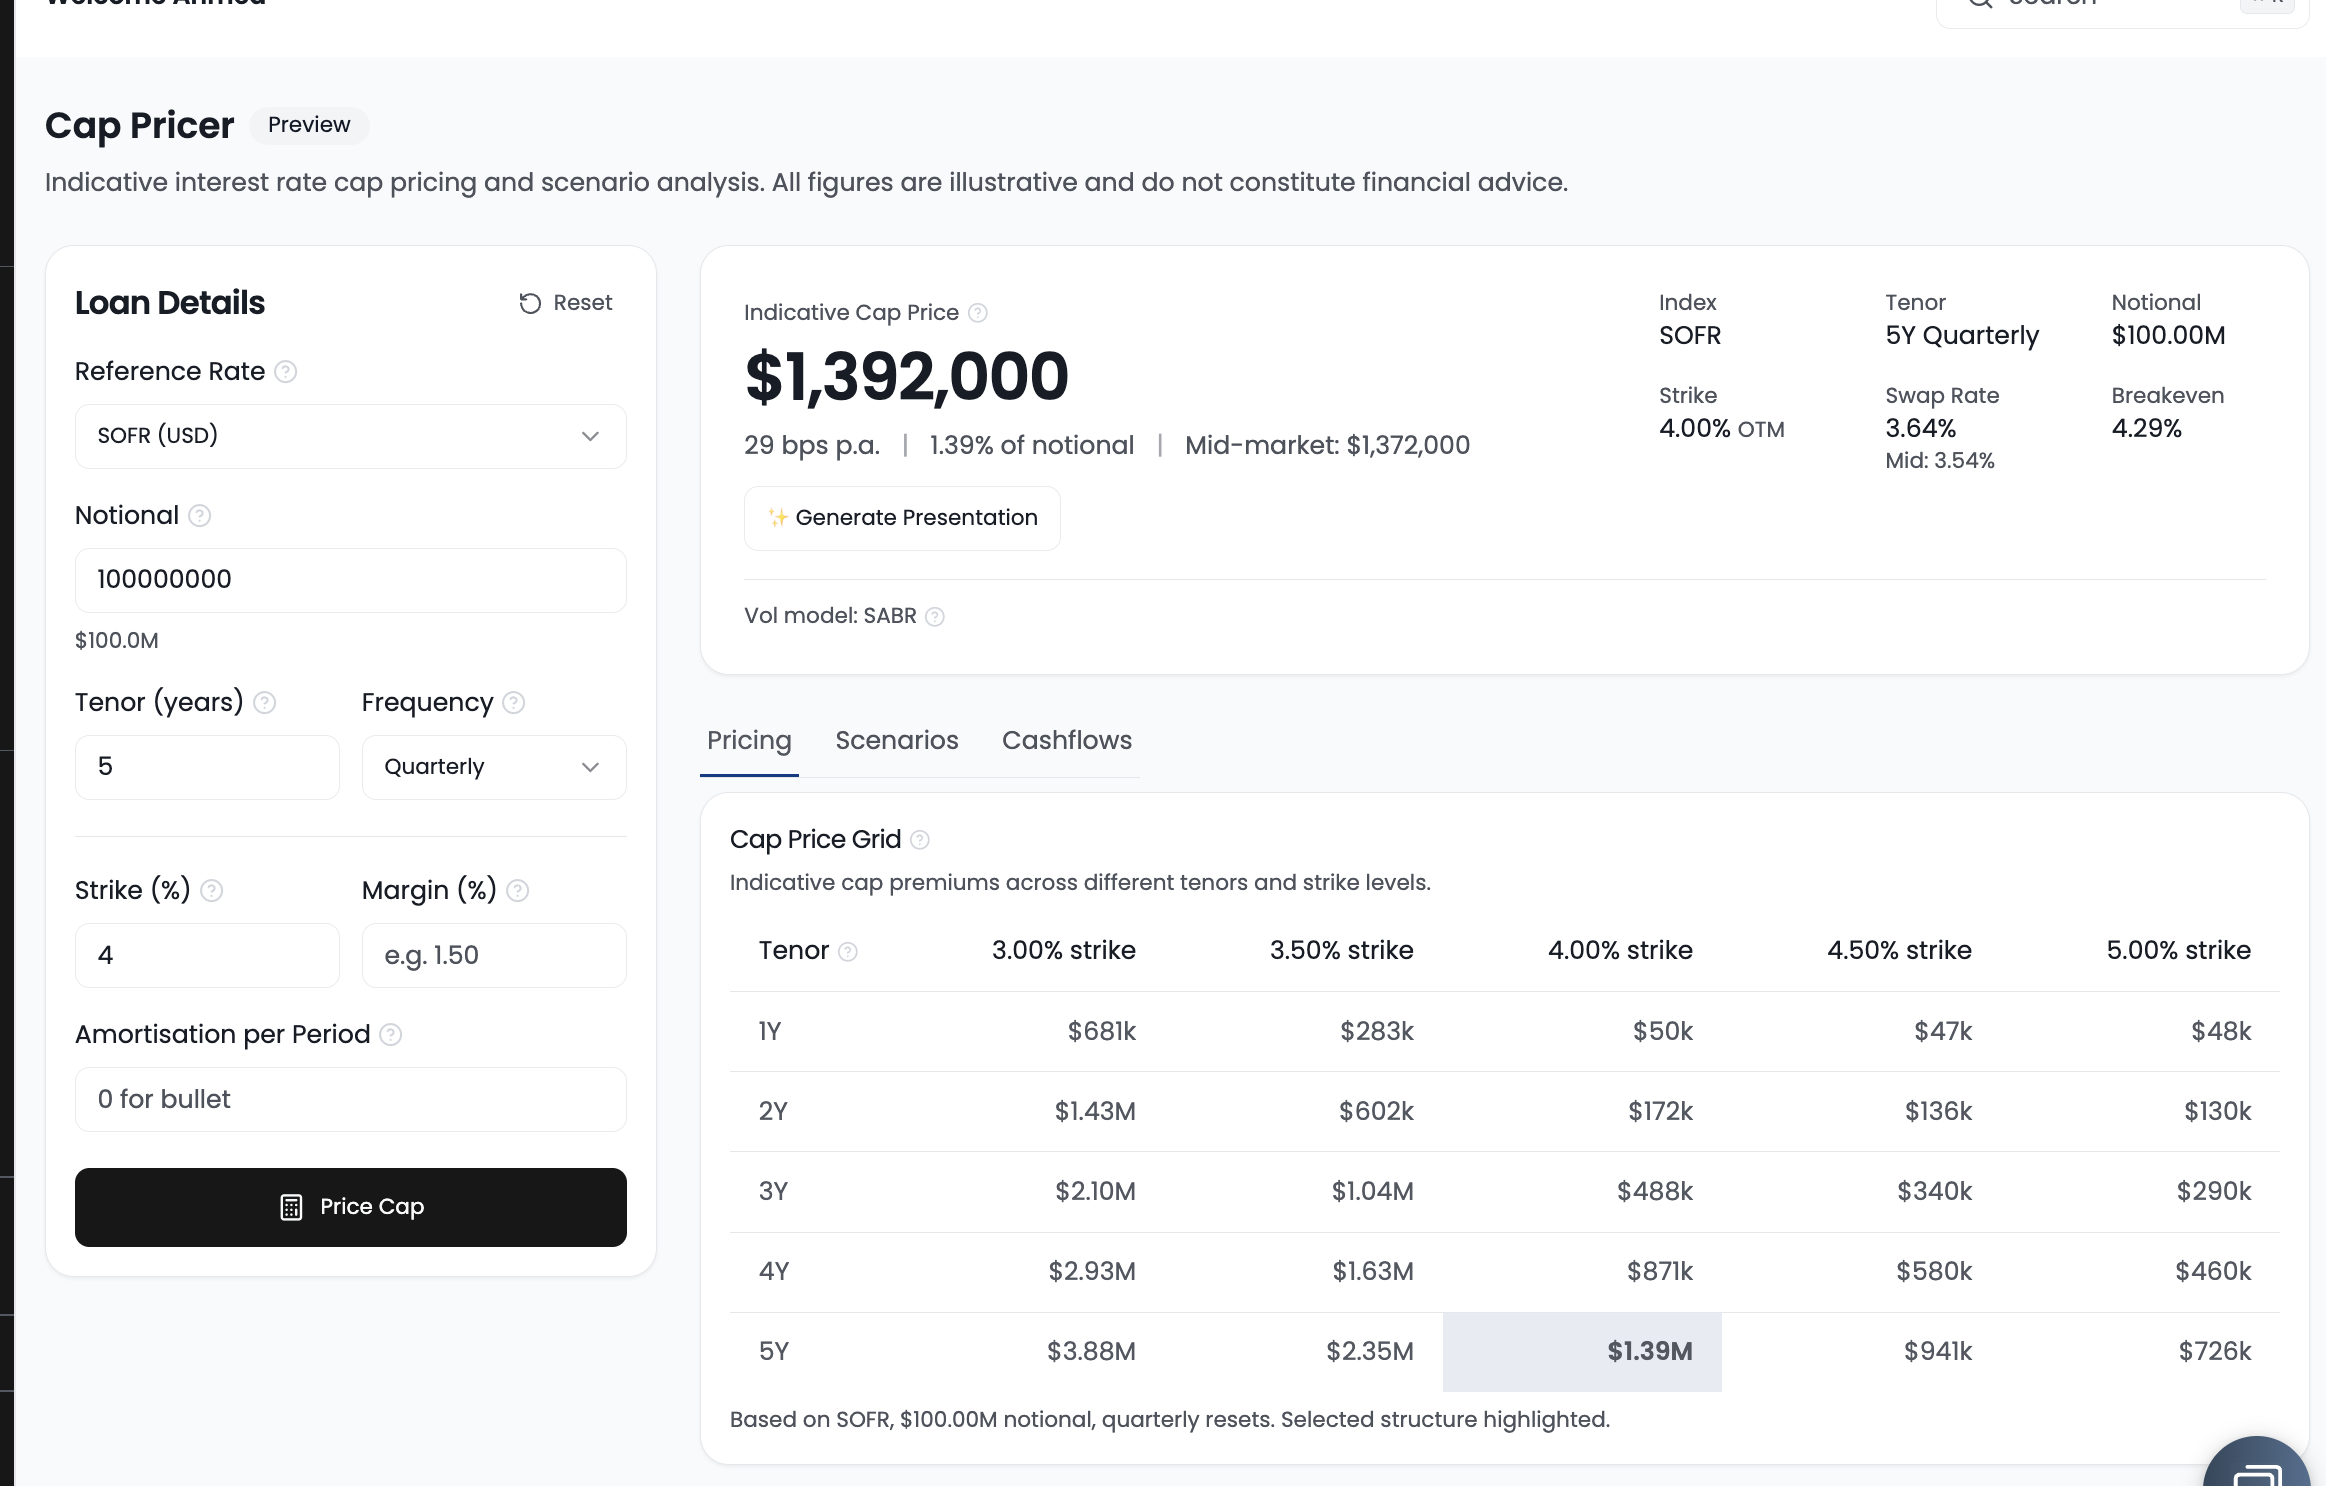
Summary Metrics

  • Cap Premium -- the upfront cost as a dollar amount and as a percentage of notional

  • Swap Rate -- the equivalent fixed rate if you swapped instead of capping

  • Breakeven Rate -- the average floating rate at which the total cost of the cap equals the swap

Cap Pricer results showing indicative price, cap price grid, and key metrics
Results summary with indicative cap price, key metrics, and price grid across tenors and strikes
Scenario Analysis

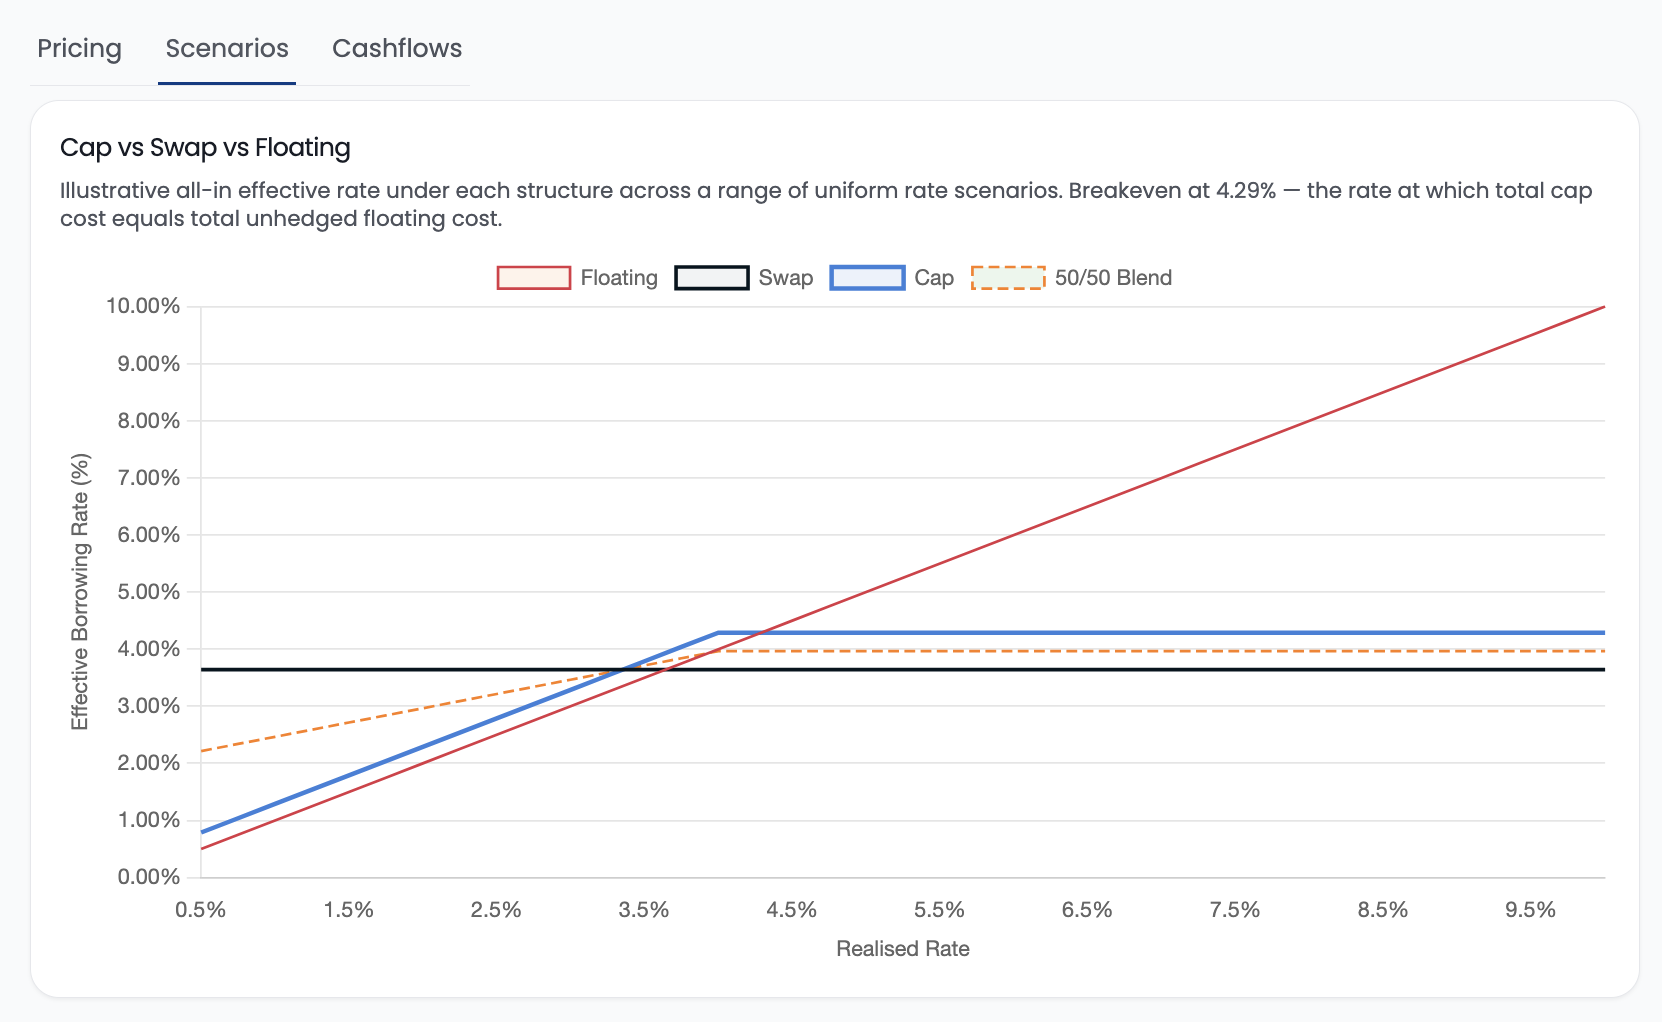
A table showing your all-in interest cost under different rate assumptions, comparing four strategies:

  • Floating (unhedged)

  • Swap (fully fixed)

  • Cap (capped upside, floating downside)

  • 50/50 Blend (half swapped, half capped)

Cap vs Swap vs Floating scenario analysis chart
Cap vs Swap vs Floating: effective borrowing rate under different rate scenarios

Cap Price Grid

A matrix of indicative cap prices across different tenors and strikes. Use this to quickly see how the cost changes if you adjust your parameters.

Caplet Breakdown

Per-period detail showing the forward rate, implied volatility, NPV, delta, and vega for each caplet in the structure.

SABR volatility smile: For SOFR caps, the pricer uses a SABR model calibrated from market data. Other indices use flat ATM volatility.


4. Supported Indices

The Cap Pricer supports 30+ indices including:

  • G10: SOFR, SONIA, 1M/3M/6M EURIBOR, SARON, TONAR, TIBOR, AONIA, CDOR

  • Nordics: NOWA, SWESTR, STINA, DESTR, CITA

  • Asia-Pacific: HIBOR, HONIA, KLIBOR, OCR, NZONIA, TAIBOR

  • Middle East & Africa: SAIBOR, JIBAR, ZARONIA

  • LatAm & CEEMEA: TIIE, TIIEON, PRIBOR, BUBOR


Swap PricerPricing an Interest Rate Cap

Last updated

Was this helpful?