
SAR Swaps Cost 115bp More Than USD. Currency Risk Explains Only 17bp.

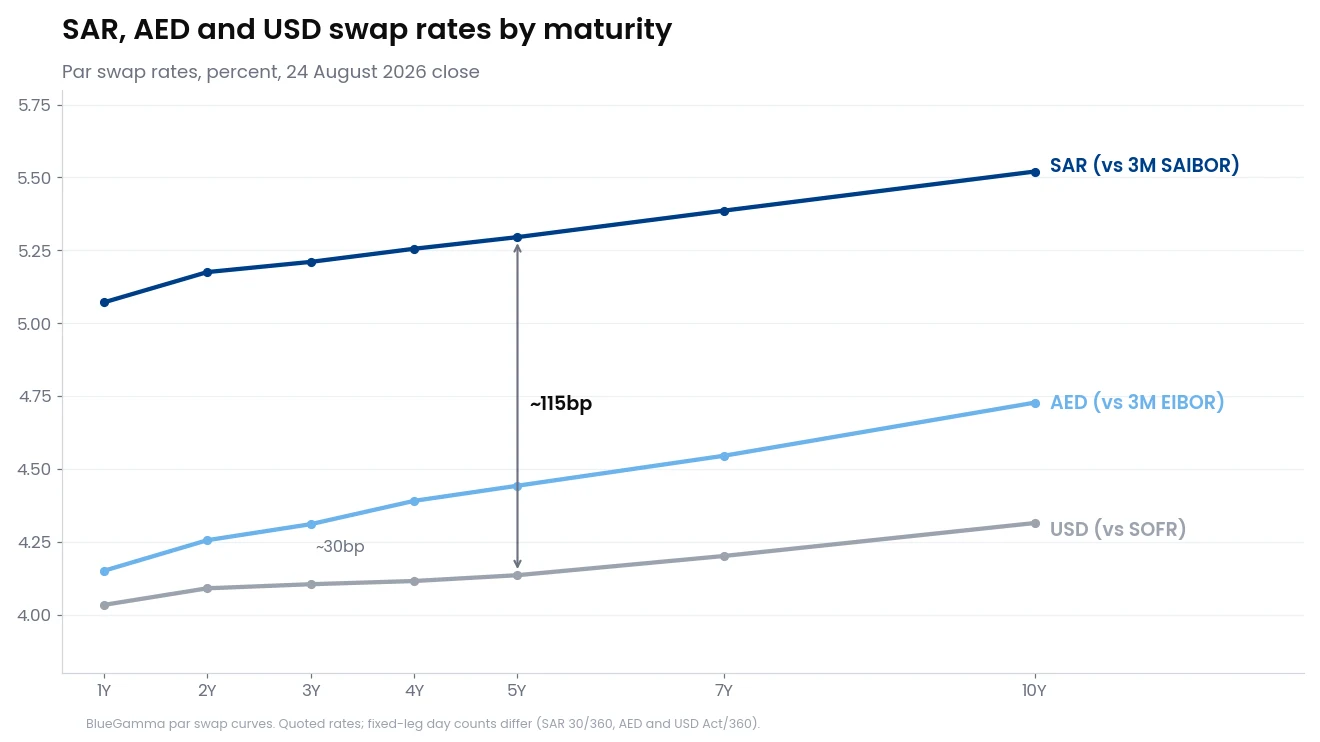
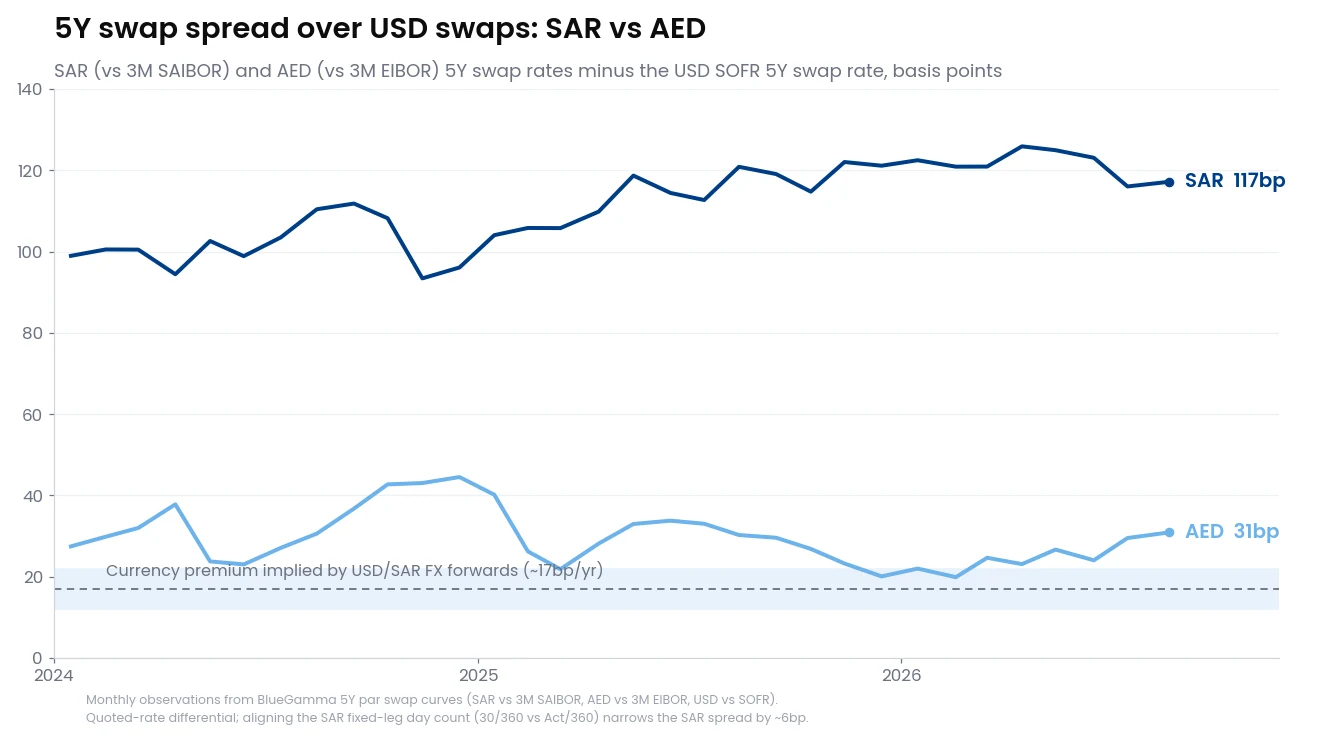
Fixing riyal debt costs roughly 115bp a year more than fixing dollar debt. A treasurer taking out a five-year swap, or a fund locking the rate on a riyal-denominated project, currently pays around 5.30% in SAR against 4.13% for the equivalent USD trade. And it is not a Gulf-wide phenomenon: the UAE runs the same dollar peg, yet a dirham treasurer pays only about 30bp over USD.
As of the 24 August 2026 close, the gap between SAR swap rates and USD swap rates holds across the curve:
| Tenor | SAR swap (vs 3M SAIBOR) | USD swap (vs SOFR) | Spread |
|---|---|---|---|
| 1Y | 5.07% | 4.03% | ~104bp |
| 2Y | 5.18% | 4.09% | ~109bp |
| 5Y | 5.30% | 4.13% | ~116bp |
| 10Y | 5.52% | 4.31% | ~121bp |
The same picture as a chart, with the dirham added for later:
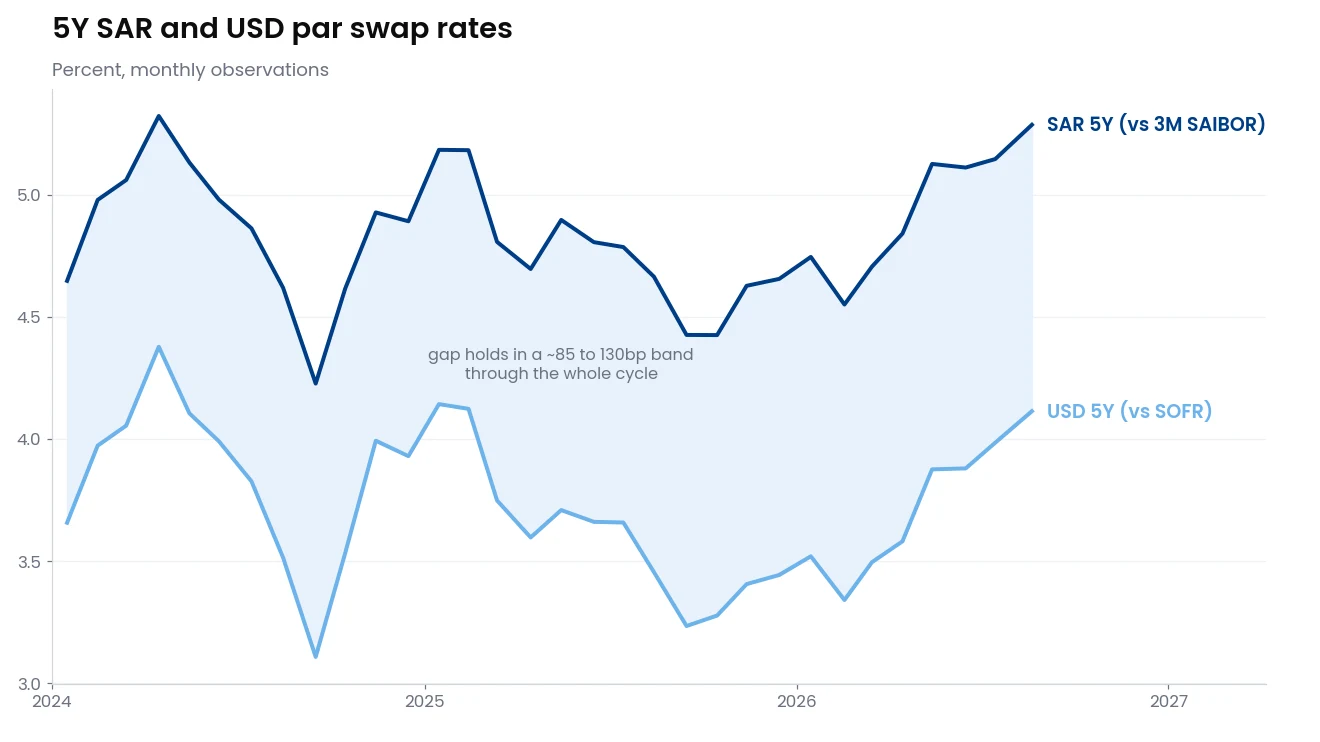
It is not new, either. The two curves have sold off and rallied together for two and a half years, and through all of it the spread held an 85 to 130bp band:
At first glance, that is surprising. A hard peg with an open capital account should pull riyal rates close to dollar rates, and the peg has held at 3.75 for almost four decades. So what is driving the roughly 115bp spread? We think it can broadly be broken into four components:
| Component of the SAR − USD swap spread | Roughly (5Y) |
|---|---|
| The benchmark mismatch: an unsecured 3M IBOR-style rate vs a secured overnight rate | ~30bp |
| + Riyal bank funding conditions | ~70bp |
| + Monetary expectations and currency premium | ~17bp |
| + Liquidity and term premia | ~0bp |
| = 5Y SAR swap − 5Y USD swap | ~115bp |
Rounded midpoints of estimated ranges; the components are estimates and do not sum exactly.
The first three components all sit inside the gap between the two benchmarks, so none of them can be read directly off a single market. We start with the observed benchmark gap, use FX forwards to estimate the currency component, and use the AED market as a comparison for the benchmark mismatch. Whatever those estimates leave unexplained falls into the last bucket, liquidity and term premia.
The gap between the two benchmarks (~120bp)
A large part of the difference starts with the benchmarks themselves. A SAR swap fixes 3M SAIBOR, the rate at which Saudi banks lend to each other unsecured for three months, so it embeds bank credit risk and Saudi funding conditions. A USD swap fixes SOFR, an overnight rate secured by US Treasuries, which is close to risk-free.
Two structural facts sharpen the comparison. Since its 2022 reform, SAIBOR is anchored to panel banks' actual funding transactions, with the published rate capped at 20bp above their measured cost of funds. This means movements in SAIBOR are closely linked to banks' actual funding costs, rather than being a quoting convention. And unlike LIBOR, SAIBOR has no announced successor and no risk-free fallback, so the floating leg of a 5Y SAR swap means SAIBOR for the life of the trade.
A 5Y swap rate largely reflects the market's expected path of its floating benchmark over the life of the trade, so the swap spread is above all a view on the future gap between these two rates. That gap is directly observable in the daily fixings, and it has been wide for years. Comparing 3M SAIBOR with 3M compounded SOFR:
| Period | Average gap | Range |
|---|---|---|
| Late 2023 | ~97bp | 88 to 103bp |
| 2024 | ~75bp | 27 to 99bp |
| 2025 | ~95bp | 60 to 142bp |
| 2026 so far | ~112bp | 79 to 146bp |
| Now (24 Aug 2026) | ~120bp |
Two notes on reading that table. The narrow prints in the middle are a measurement artefact: compounded SOFR is backward-looking while SAIBOR is forward-looking, so the gap compresses mechanically while the Fed is cutting. And in stable-rate periods the gap has generally traded around 90 to 120bp; the last two months have been at the upper end of that range and slightly beyond it.
Independent observers see the same picture. The IMF's latest Article IV assessment describes the 3M spread fluctuating between roughly 90 and 140bp on the back of double-digit credit growth, and Saudi banking analysts put the longer-run norm closer to 70bp.
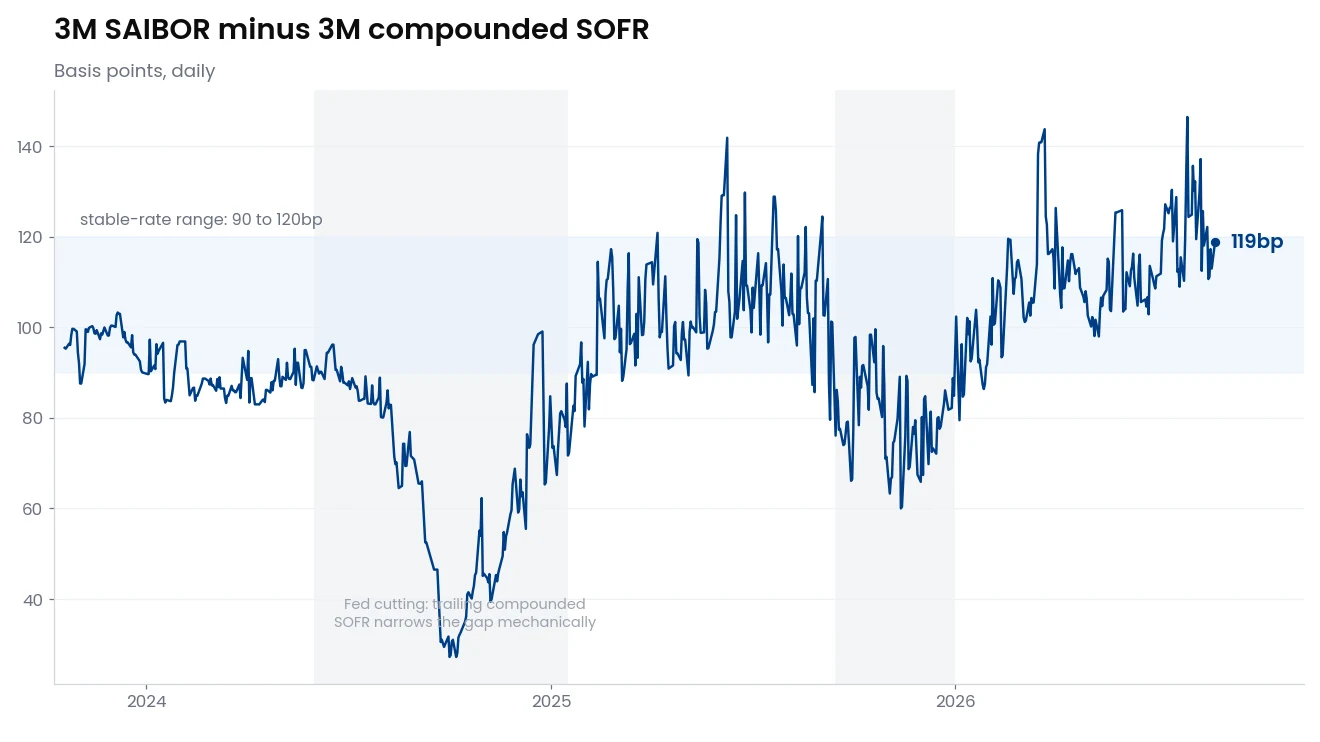
Now put the swap spread next to the spot gap: ~116bp against ~120bp. The current swap curve suggests the market expects much of today's funding premium to persist over the next five years. That is worth noting, because the gap sits at the high end of its own history, liquidity data has begun to ease at the margin (deposit growth has outpaced credit growth in recent quarters), and a Fed hike would narrow the gap from the dollar side with no change in Saudi conditions.
One subtlety before moving on. This observable ~120bp gap bundles three of the four components: the benchmark mismatch, the riyal funding premium, and any genuine difference in risk-free rates between the two currencies. FX forwards help isolate the currency piece.
The currency component, from FX forwards (~17bp)
FX forwards give the clearest market-based indication of the currency component. A forward price is not a forecast; it is an arbitrage. A bank selling you dollars five years forward hedges itself today: it borrows dollars, converts them to riyal at spot, and parks the riyal at riyal rates until delivery. The forward price that makes that trade break even is spot adjusted by the gap between the two currencies' rates (covered interest parity).
That means forward points can only contain two things: differences in expected policy rates between SAMA and the Fed, and any extra yield the market demands for holding riyal at all, the devaluation premium. In practice the first piece is close to zero by design, because SAMA moves its policy rate in step with the Fed, typically within hours of each decision, so most of what forwards price beyond that reflects the devaluation premium. They cannot contain SAIBOR's bank credit premium, because no leg of the arbitrage transacts at SAIBOR. In practice, the premium implied by forwards is small:
- If the full 115bp were currency risk, arbitrage would force the 5Y USD/SAR forward to trade roughly 5.9% above spot.
- What forwards actually price: with spot pinned near 3.756, the 5Y forward trades around 3.787. That is a cumulative premium of just 0.83%, or about 17bp per year.
- The 1Y point agrees: the 1Y forward sits about 21bp above spot.
- 17bp likely overstates pure devaluation risk: it bundles the true rate differential together with any devaluation premium. Either way, it is small relative to the ~115bp swap spread.
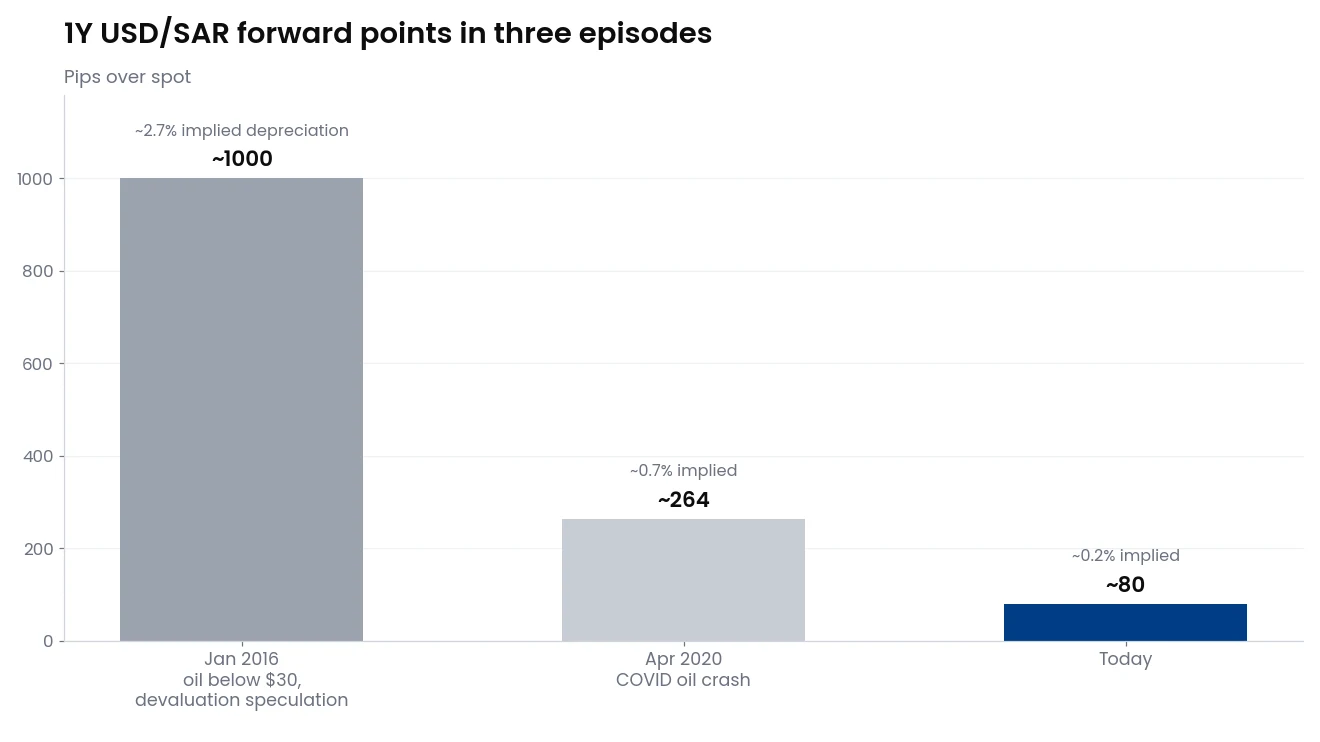
There is also historical evidence that the forward market responds when concerns around the peg rise. In early 2016, with oil below $30, 1Y USD/SAR forward points spiked from single digits to a record of roughly 1,000 points, about 2.7% of implied depreciation. They jumped again to around 264 points in the spring 2020 oil crash. Today (late August 2026) they sit near 80. The IMF's current assessment reads the same way: the peg is appropriate and the external buffers ample.
Two caveats belong here. First, SAR forwards are a managed market. SAMA has historically intervened in the forward market directly and restricted speculative forward products, so quoted points reflect policy as well as positioning. There is, deliberately, no offshore riyal market to quote a second opinion. Second, for rates readers: the same observation can be restated as a cross-currency basis. FX-swap-implied riyal yields sit close to dollar yields while SAIBOR-linked rates sit about 100bp above them. That is exactly the benchmark premium this note is decomposing.
That suggests roughly 100bp of the benchmark gap is explained by factors other than the currency component captured in forwards. But that 100bp still mixes two things: the benchmark mismatch that exists in every IBOR-style market, and the premium specific to riyal funding. The dirham market helps separate them.
The dirham comparison: sizing the benchmark mismatch (~30bp)
AED provides a useful comparison, because the UAE also maintains a dollar peg and 3M EIBOR has a similar unsecured term-rate structure to SAIBOR. Funding pressure, however, appears much less pronounced: for much of the past two years 3M EIBOR actually fixed at or below compounded SOFR, consistent with a banking system flush with deposits. AED forwards also imply very little currency premium:
| SAR | AED | |
|---|---|---|
| 5Y swap spread over USD | ~116bp | ~30bp |
| 5Y FX forward vs spot | +0.83% (~17bp per year) | roughly flat |
| 1Y FX forward vs spot | +21bp | slightly below spot |
| Benchmark referenced | 3M SAIBOR | 3M EIBOR |
With very little currency premium and much less funding pressure, the dirham's ~30bp spread is a useful estimate of the benchmark mismatch (~25 to 30bp) plus a few basis points of liquidity and term premia. Applying that estimate to the Saudi side: take ~116bp of spread, subtract ~17bp for the currency component and ~30bp for the benchmark mismatch, and roughly 70bp remains, which looks largely attributable to riyal bank funding conditions. The much smaller AED spread also argues against the dollar peg itself being the main explanation for the SAR premium.
The banking data supports that interpretation. Saudi bank lending has outgrown deposits for most of the Vision 2030 era: SAR 372bn of new loans against SAR 219bn of deposit growth in 2024 alone. The sector's loan-to-deposit ratio has run above 108%, against a ten-year average near 96%, and banks raised a record $33bn in international markets last year, roughly three times the previous record. Rating agencies expect the funding gap to persist for several more years, which is consistent with what the swap curve is pricing.
Putting the numbers together
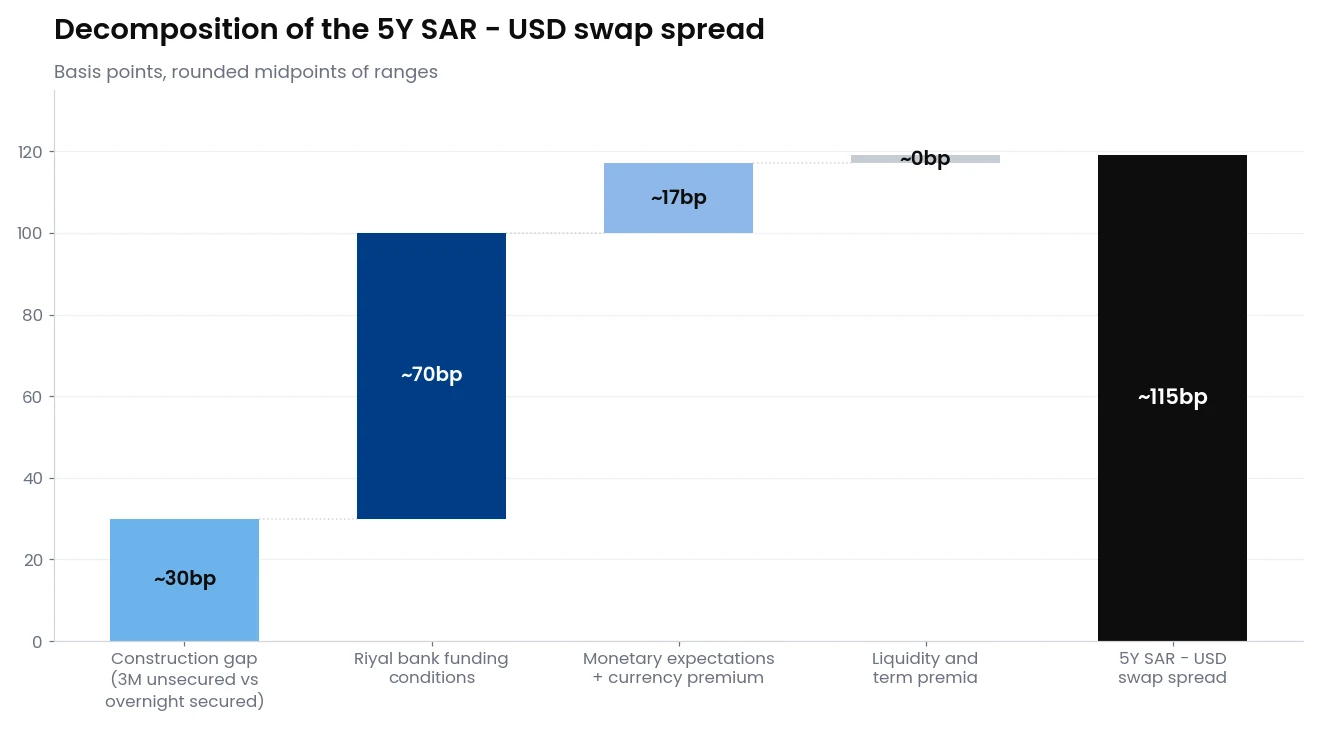
| Component | How it is estimated | 5Y contribution |
|---|---|---|
| Benchmark mismatch: 3M unsecured IBOR vs secured overnight | from the AED/EIBOR spread, where funding and currency effects appear small | ~25 to 30bp |
| Riyal bank funding conditions | what remains of the SAIBOR/SOFR gap after the currency and benchmark-mismatch estimates | ~65 to 75bp |
| Monetary expectations and currency premium | USD/SAR FX forwards | ~17bp |
| Liquidity and term premia | residual | ~0 to 5bp |
| Total: 5Y SAR − USD swap spread | swap curves | ~115bp |
What this means if you are the one fixing
- When you fix SAR debt, most of the premium appears to come from what is already inside SAIBOR, rather than from the currency. Your loan already pays SAIBOR, and SAIBOR already contains Saudi bank credit and funding costs. A pay-fixed swap converts that floating stream into a fixed one, so its price inherits the same premium. It looks expensive next to a USD swap largely because the USD swap is built on a near risk-free benchmark.
- The forward market currently prices very little devaluation premium out to five years. Whatever view you hold on the peg, FX forwards currently imply around 17bp per year, and that figure includes rate differentials as well as any devaluation premium. That is worth knowing before attributing the swap spread to currency risk.
- The curve currently prices much of today's funding premium to persist. The swap spread extrapolates a benchmark gap that sits at the top of its historical range, and the SAIBOR forward curve now slopes upward. In other words, current pricing does not imply a meaningful decline in SAIBOR over the period.
- If you are underwriting a riyal-denominated project, the rate assumption can be examined in parts. The all-in fixed rate is the USD curve plus a spread that appears to be mostly funding premium, with a currency component that forwards put around 17bp. For sensitivity analysis, the funding component may therefore be the more useful variable to stress; it is the part that has actually moved (the overall spread has ranged roughly 85 to 130bp).
In the transactions we track, riyal hedging is accelerating. As of late August 2026, SAR swap activity is running about 70% ahead of 2025's full-year total, with the growth concentrated at the short end: the average tenor of new trades has shortened from roughly five years to under three.
Watch it live
Everything in this note is reproducible from our platform: the SAIBOR forward curve, SAR swap rates, Saudi government bond and sukuk yields, and USD/SAR forwards are all live. You can price a SAR swap against the current curve in the app in under a minute, or download the SAIBOR forward curve straight into Excel for your model. If you are working through a riyal hedging decision, book a call with our team.
Curve levels are end-of-day 24 August 2026 and move a few basis points day to day. Spreads are quoted-rate differentials: the SAR fixed leg accrues 30/360 while the USD fixed leg accrues Act/360, and restating the SAR leg on Act/360 lowers its quoted rate by roughly 7bp, so like-for-like spreads are slightly tighter than the differentials shown; the AED comparison needs no adjustment. The FX forward analysis is limited to tenors of five years and under, where forward pricing is deep. Nothing here is a prediction about the peg or hedging advice; it is a description of what market pricing currently implies.
Frequently asked questions
Why are SAR swap rates higher than USD swap rates?
Because the floating rates the two swaps are built on measure different things. A SAR swap fixes 3M SAIBOR, the rate at which Saudi banks lend to each other unsecured for three months, so it contains bank credit risk and the cost of riyal liquidity. A USD swap fixes SOFR, an overnight rate secured by US Treasuries, which is close to risk-free. Most of the roughly 115bp gap appears to come from that difference between the two benchmarks; FX forwards attribute only about 17bp a year to the riyal itself.
Does the SAR swap spread mean the riyal peg is at risk?
Current forward pricing does not suggest peg risk is the main driver of the spread. USD/SAR forwards trade less than 1% above spot at the 5Y point, which works out to about 17bp a year of implied compensation for holding riyal rather than dollars, small relative to the overall swap spread. This is a description of current market pricing, not a forecast.
What is SAIBOR?
SAIBOR is the Saudi Arabian Interbank Offered Rate, the benchmark that most riyal floating-rate loans and swaps reference. It is published daily across tenors, and SAR interest rate swaps typically exchange a fixed rate against 3M SAIBOR. You can see the market's expected path of SAIBOR on our SAIBOR forward curve page.
How can I see live SAR swap rates and forwards?
BlueGamma publishes live SAR swap rates and the SAIBOR forward curve, and in the app you can price a SAR swap against the current curve, download the forward curve to Excel, or pull it through the API.
.png)