Whether you are a seasoned professional or just getting started, it is essential to understand the basics of the forward curve as that underpins most market analysis. This article will take you through the basics of forward curves, including its definition, types, factors influencing it, and how to construct a curve.
What is a Forward Curve?
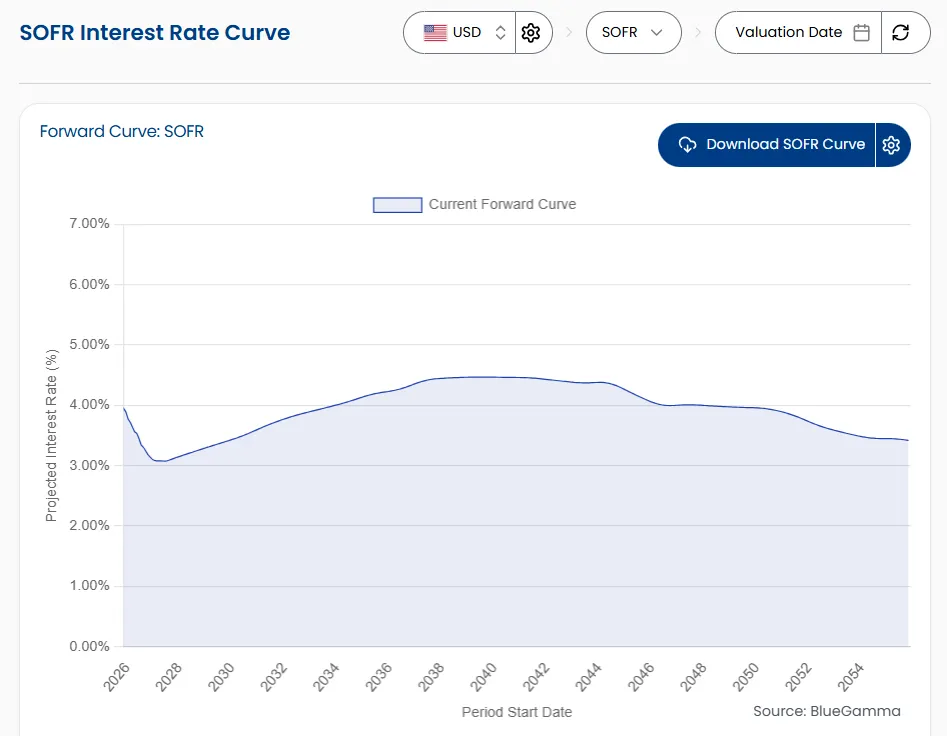
The forward curve is a graphical representation of expected prices (or rates) in the future. The curve graphs a set of Forward Rates which are typically shown on the Y-axis and Dates on the X-axis, as shown in the image above. The forward curve shows the expected future prices (or rates) of a particular asset for a specific maturity and reflects the market's consensus on the future prices (or rates).
In the case of interest rates, the interest rate forward curve shows market expectations of interest rates in the future. Take the example of 6 month SOFR, the forward curve reflects the markets expectation of 6 month SOFR starting at a future point in time (point on the curve) for 6 months.
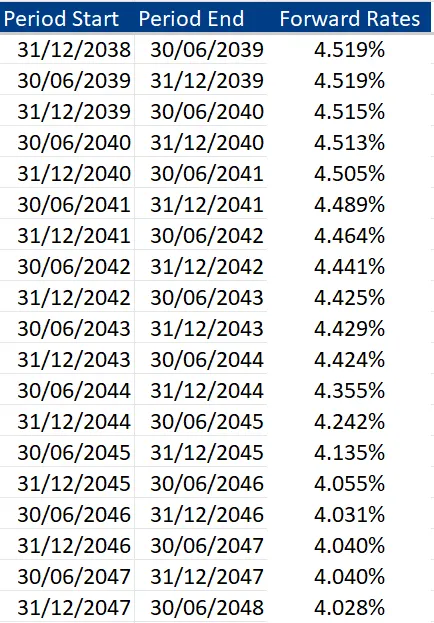
Given the forward curve is a graphic representation of forward rates, the table below shows what a set of forward rates looks like, which would be converted into a graph.
Definitions
Some definitions that are useful to bear in mind and help avoid confusion
- Forward Curve: A graphical representation showing the expected future prices or rates of a particular asset or financial instrument over different times in the future
- Forward Rate: The anticipated future interest rate or price for a financial instrument or commodity, as indicated by the forward curve
- Yield Curve: A specific type of forward curve that shows the yields on bonds (with equal credit quality) over different maturity dates
- Spot Rate: The current interest rate or price of a financial contract or commodity for immediate settlement
Types of Forward Curves
Forward curves are an essential tool for investors and traders who want to predict future prices and make informed decisions. There are two main types of forward curves used by financing teams, which are
1. interest rate curves
2. currency forward curves
Interest Rate Forward Curves
The interest rate forward curve shows the expected future interest rates for specific maturities. This curve is essential for in pricing derivative contracts such as swaps and options.
The shape of the curve shows future expectations of interest rates, which moved based on the factors we discuss below. For example, a steeply downward-sloping curve, suggests that the market expects lower interest rates in the future due to expectations of lower inflation. Conversely, a flat or inverted yield curve suggests that the market expects weaker economic growth and lower inflation.
Factors influencing the interest rate forward curve include central bank policies, inflation expectations, and economic indicators such as GDP and unemployment rates. For example, if the central bank signals that it will raise interest rates in the future to combat inflation, the interest rate forward curve will likely slope upward.
Currency Forward Curves
The currency forward curve shows the market's expectation of forward rates for a particular currency pair for a period of time in the future. This curve is essential for companies engaged in international trade and investors who want to hedge their currency risk.
The shape of the currency forward curve can provide insights into market expectations about future economic and political developments.
For example, a steeply upward-sloping curve, known as a "forward premium," suggests that the market expects the domestic currency to appreciate in the future due to expectations of higher interest rates or stronger economic growth.
Conversely, a "forward discount" curve indicates that the market expects the domestic currency to depreciate in the future.
Factors influencing the currency forward curve include interest rate differentials, economic policies, geopolitical events, and investor sentiment. For example, if a country's central bank signals that it will raise interest rates in the future, the currency forward curve will likely slope upward as investors anticipate an appreciation of the domestic currency.
Check out our guide on Forex Forecasting for Long-Dated Cash Flow.
How to Construct a Forward Curve
Data Collection and Sources
The first step in constructing a forward curve is collecting relevant data from market sources.
For interest rates forward curves you will require:
- Swap Rates: Think of these as the fixed rates in a swap agreement, helping to determine the costs or returns of various financial transactions over time. These are essential in constructing the longer end of the curve
- FRAs (Forward Rate Agreements): Essentially, these are agreements that determine an interest rate to be paid at a specified future date. They're like 'forward bookings' for interest rates. The rates agreed upon in FRAs are used to construct the short to medium parts of the EURIBOR curve
- Futures: These are contracts agreeing to buy or sell a particular asset at a set price in the future. The prices of these futures can be used to infer future interest rates and are particularly useful in constructing the short-end of the EURIBOR curve
- Fixings: These are daily rates, such as EURIBOR, that represent the average interest rate at which major banks lend to one another. The daily fixings help to anchor the very short end of the forward curve, ensuring that the curve accurately reflects current market conditions
Market participants can use several sources of data, including exchange and spot market data, analyst reports, and economic data releases. It is important to gather data from multiple sources to ensure a comprehensive understanding of the market.
Exchange and spot market data provide real-time information on current prices and market trends. Analyst reports offer insights into market sentiment and expectations for future price movements. Economic data releases, such as inflation and GDP reports, can also impact forward prices and should be taken into consideration.
Interpolation and Extrapolation Techniques
Once the data is collected, market participants can use interpolation and extrapolation techniques to fill in gaps and estimate prices for specific maturities not covered by the data.
Interpolation techniques include linear interpolation and spline interpolation. Linear interpolation is a simple method that connects two data points with a straight line. Spline interpolation is a more complex method that uses a mathematical function to estimate prices for intermediate maturities.
Extrapolation techniques include linear and exponential extrapolation. Linear extrapolation extends the forward curve beyond the last observed data point using a straight line. Exponential extrapolation assumes that the forward curve follows a geometric progression and extends the curve accordingly.
Smoothing and Adjusting the Curve
After constructing the forward curve, market participants may use smoothing techniques to remove noise. Smoothing techniques include moving averages and exponential smoothing
- Moving averages calculate the average price over a specified time period
- Exponential smoothing places more weight on recent data points.
Use Cases
- Risk Management: Financial institutions use the interest rate forward curve to manage interest rate risk. By understanding expected future rates, they can strategize their borrowing or lending activities to minimize risk. For instance, if the curve suggests rising rates, a bank may increase its proportion of fixed-rate loans to lock in lower rates.
- Pricing of Financial Instruments: The forward curve is instrumental in determining the pricing of various financial products, including bonds, loans, and interest rate derivatives. It helps in setting the appropriate interest rates for these instruments based on future expectations.
- Investment Decisions: Investors use the forward curve to make informed decisions about buying or selling fixed-income assets. If the curve indicates an increase in rates, an investor might delay bond purchases, expecting bond prices to drop as rates climb.
- Hedging Strategies: Traders and financial institutions use the forward curve to hedge interest rate exposure. For example, if a trader expects interest rates to rise, they might take positions in interest rate futures to hedge against potential losses in their bond portfolio.
- Derivative Pricing: The forward curve is vital for pricing interest rate derivatives such as futures, options, and swaps. Traders and market makers use it to model the future value of these contracts, enabling them to set fair and competitive prices.
- Economic Forecasting: Economists and policymakers analyze the forward curve to gauge market expectations about the direction of the economy. A steepening curve might indicate expectations of economic growth, while a flattening curve could signal a slowdown.
Adjusting the curve involves using market knowledge and expertise to modify the forward curve based on factors such as supply and demand dynamics, geopolitical events, and economic indicators. This can be a valuable tool for active portfolio management and investment decision making.
Overall, an accurate forward curve is critical for market participants to make informed decisions regarding risk management and pricing. A thorough understanding of the forward curve and the factors that influence it is a valuable tool for active portfolio management and investment decision making. By collecting relevant data, using interpolation and extrapolation techniques, and smoothing and adjusting the curve, market participants can construct a forward curve that reflects their view of the market and enables them to make informed decisions.
Software providers like BlueGamma automate the curve construction process and connect to data providers. If you're looking for more information on how we build our curves, we'd be happy to hear from you!