Whenever a financial model has cash flows in different currencies, the FX forecast becomes a key assumption. For short horizons, spot or flat assumptions often work fine, but for long-dated cash flows, the methodology can materially change the results.
There are several ways we see modellers approaching forex forecasting, depending on which economic factors they need to capture. Below, we break down the three primary approaches used in financial modelling.
Forecasting FX rates: 3 Key Approaches
In most multi-currency financial models, the FX assumption is set early in the inputs section. Modellers typically choose between three approaches, depending on what economic factors they want to capture.
1. Forward Rates (market-implied)
This is the most common approach we see. It represents the "market price" of liquidity at future dates.
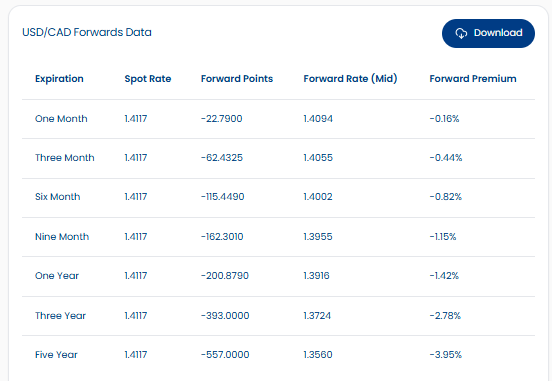
- How it works: Forward FX rates are built from observable, traded forward points. They are derived from interest rate differentials between the two currencies plus the cross-currency basis. For most major currency pairs, the market is highly liquid out to around 1 year. Beyond that, the curve becomes more extrapolated than traded.
- The Use Case: Because the short end is market-anchored, forward rates are the standard input for near-term forecasting (typically the first 1-3 years).
- Data Access: Forward rates can be pulled directly from any market data platform that publishes FX forwards. (We surface these directly in BlueGamma USD/CAD Forwards Data table here).
- Grab a 14-day free trial to access a wide range of forward rates
2. Interest Rate Parity (IRP)
Similar to the forward rates above, but this model uses only the interest rate differentials without any other adjustment (like the cross-currency basis).
- How it works: This model is derived using the interest rate curves (zero curves or discount rates) for both currencies. You take the ratio of the two discount factors to compute the theoretical forward exchange rate. Unlike market forwards, the IRP method does not include the cross-currency basis.
- The Use Case: IRP can give a better long-term view than using market forwards when forward markets are not that liquid (especially for emerging market currencies). It is usually very similar to the market forward curve when the cross-currency basis is small (as is the case for USDCAD). It’s harder to calculate than using forward points because you need discount factors for both currencies, but once you have them, the IRP formula is just a simple one-line Excel calculation.
- Data sources: IRP requires the discount curves for both currencies. These can be built from OIS and swap markets or retrieved from platforms that publish interest rate curves (eg BlueGamma)
Interest Rate Parity (IRP) Formula
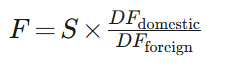
- F = implied forward FX rate
- S = current spot FX rate (domestic per foreign)
- DF_domestic = discount factor for the domestic currency
- DF_foreign = discount factor for the foreign currency
3. PPP (Purchasing Power Parity)
While IRP focuses on interest rates, Purchasing Power Parity looks at the "real" value of money over the long term.
- How it works: This model looks at inflation differences instead of interest rate differences. It assumes that over a long horizon (10+ years), exchange rates should adjust so that the purchasing power of two currencies remains at parity.
- The Use Case: This is often the preferred method for long-dated cashflow models where inflation is a major driver of revenues and costs. It is harder to set up because you need inflation forecasts, but the PPP calculation itself is a simple Excel formula once you have the data.
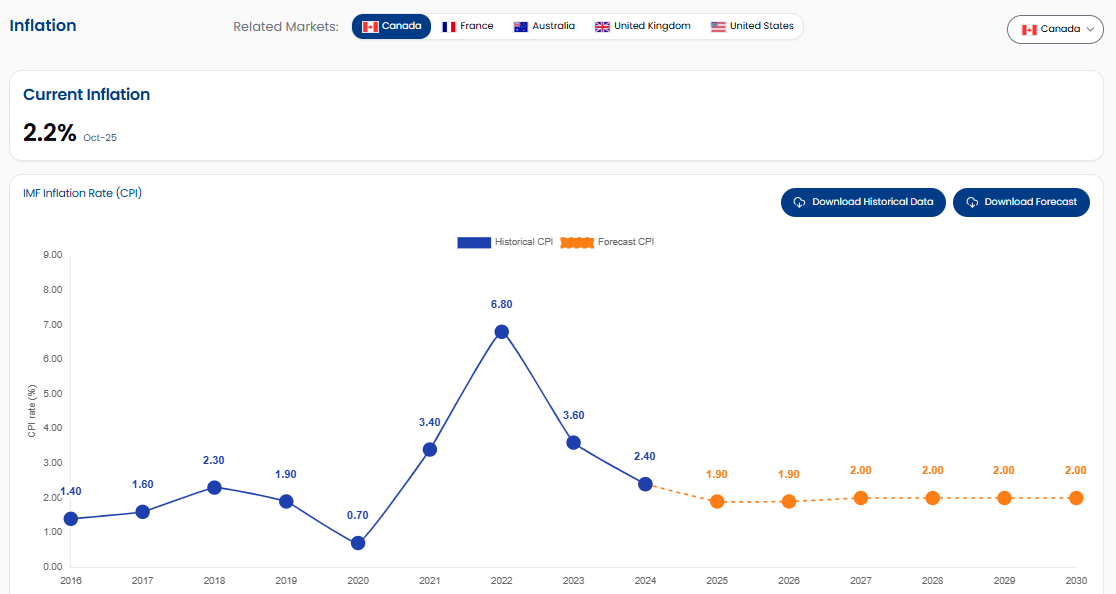
- Data Source: PPP requires inflation expectations for both currencies. The IMF inflation forecasts used for this model are taken from the Inflation Data section of our platform.
Purchasing Power Parity (PPP) Formula
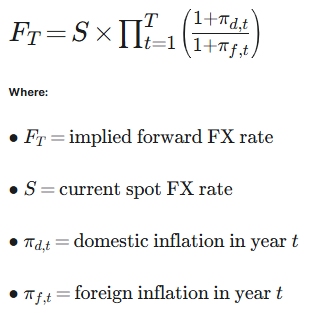
Visualising the Divergence: A USD/CAD Case Study
To understand why the choice of model matters for your cashflow forecasts, we have modelled these three approaches for USD/CAD through 2031.
Analysing the Graph

The chart above shows how quickly the different approaches behave:
- The Interest Rate View (Red & Green Lines): Both the Forward Rate and IRP curves slope downward. Given the shape of the CAD and USD interest rate curves this implies a gradual USD depreciation relative to CAD over time. When the cross-currency basis is small, IRP and the traded forward curve sit almost on top of each other.
- The Inflation View (Blue Line): The PPP model remains relatively flat. This suggests that based on inflation forecasts (purchasing power), the exchange rate should remain steady.
Why This Matters for Modelling
If you are modelling a Canadian investment with some USD cashflows, the long-term path of USDCAD can look completely different depending on the method:
- Using Forward Rates might show USDCAD falling over time.
- Using PPP might show the rate staying broadly flat.
- The gap between the forecasts can materially change the results of a model.