Most people assume a longer fixed rate always costs more. More time, more uncertainty, more for a lender to be compensated for — so 50-year money should be pricier than 25-year money. In the UK, it isn't. And it hasn't been for at least five years.
The shape almost no one notices
Look at the SONIA swap curve — the market's price for locking in a fixed rate — and it climbs the way you'd expect, right up to about 25 years. Then it stops, flattens, and quietly turns down.
Here is where it stood at the 24 June 2026 close:
| Maturity | SONIA swap rate — 24 Jun 2026 |
|---|---|
| 10Y | 4.35% |
| 25Y | 4.78% — the peak |
| 30Y | 4.77% |
| 40Y | 4.72% |
| 50Y | 4.63% |
| 60Y | 4.52% |
So a 25-year borrower pays about 0.15% more than a 50-year borrower. The old rule of thumb — longer = higher risk = more expensive — simply breaks down past the 25-year mark.
These are the actual mid-market SONIA rates BlueGamma publishes every day. You can pull the live curve — and price a swap against it — inside a free trial. Start a 14-day trial →
This isn't a quirk of today's market
The obvious objection: maybe that's just where rates happen to sit right now. It isn't.
We pulled the 25-year and 50-year SONIA swap rate at the end of every month back to January 2021 — 66 months in all. The 25-year rate was higher than the 50-year rate in all 66 of them. Not once has it flipped.
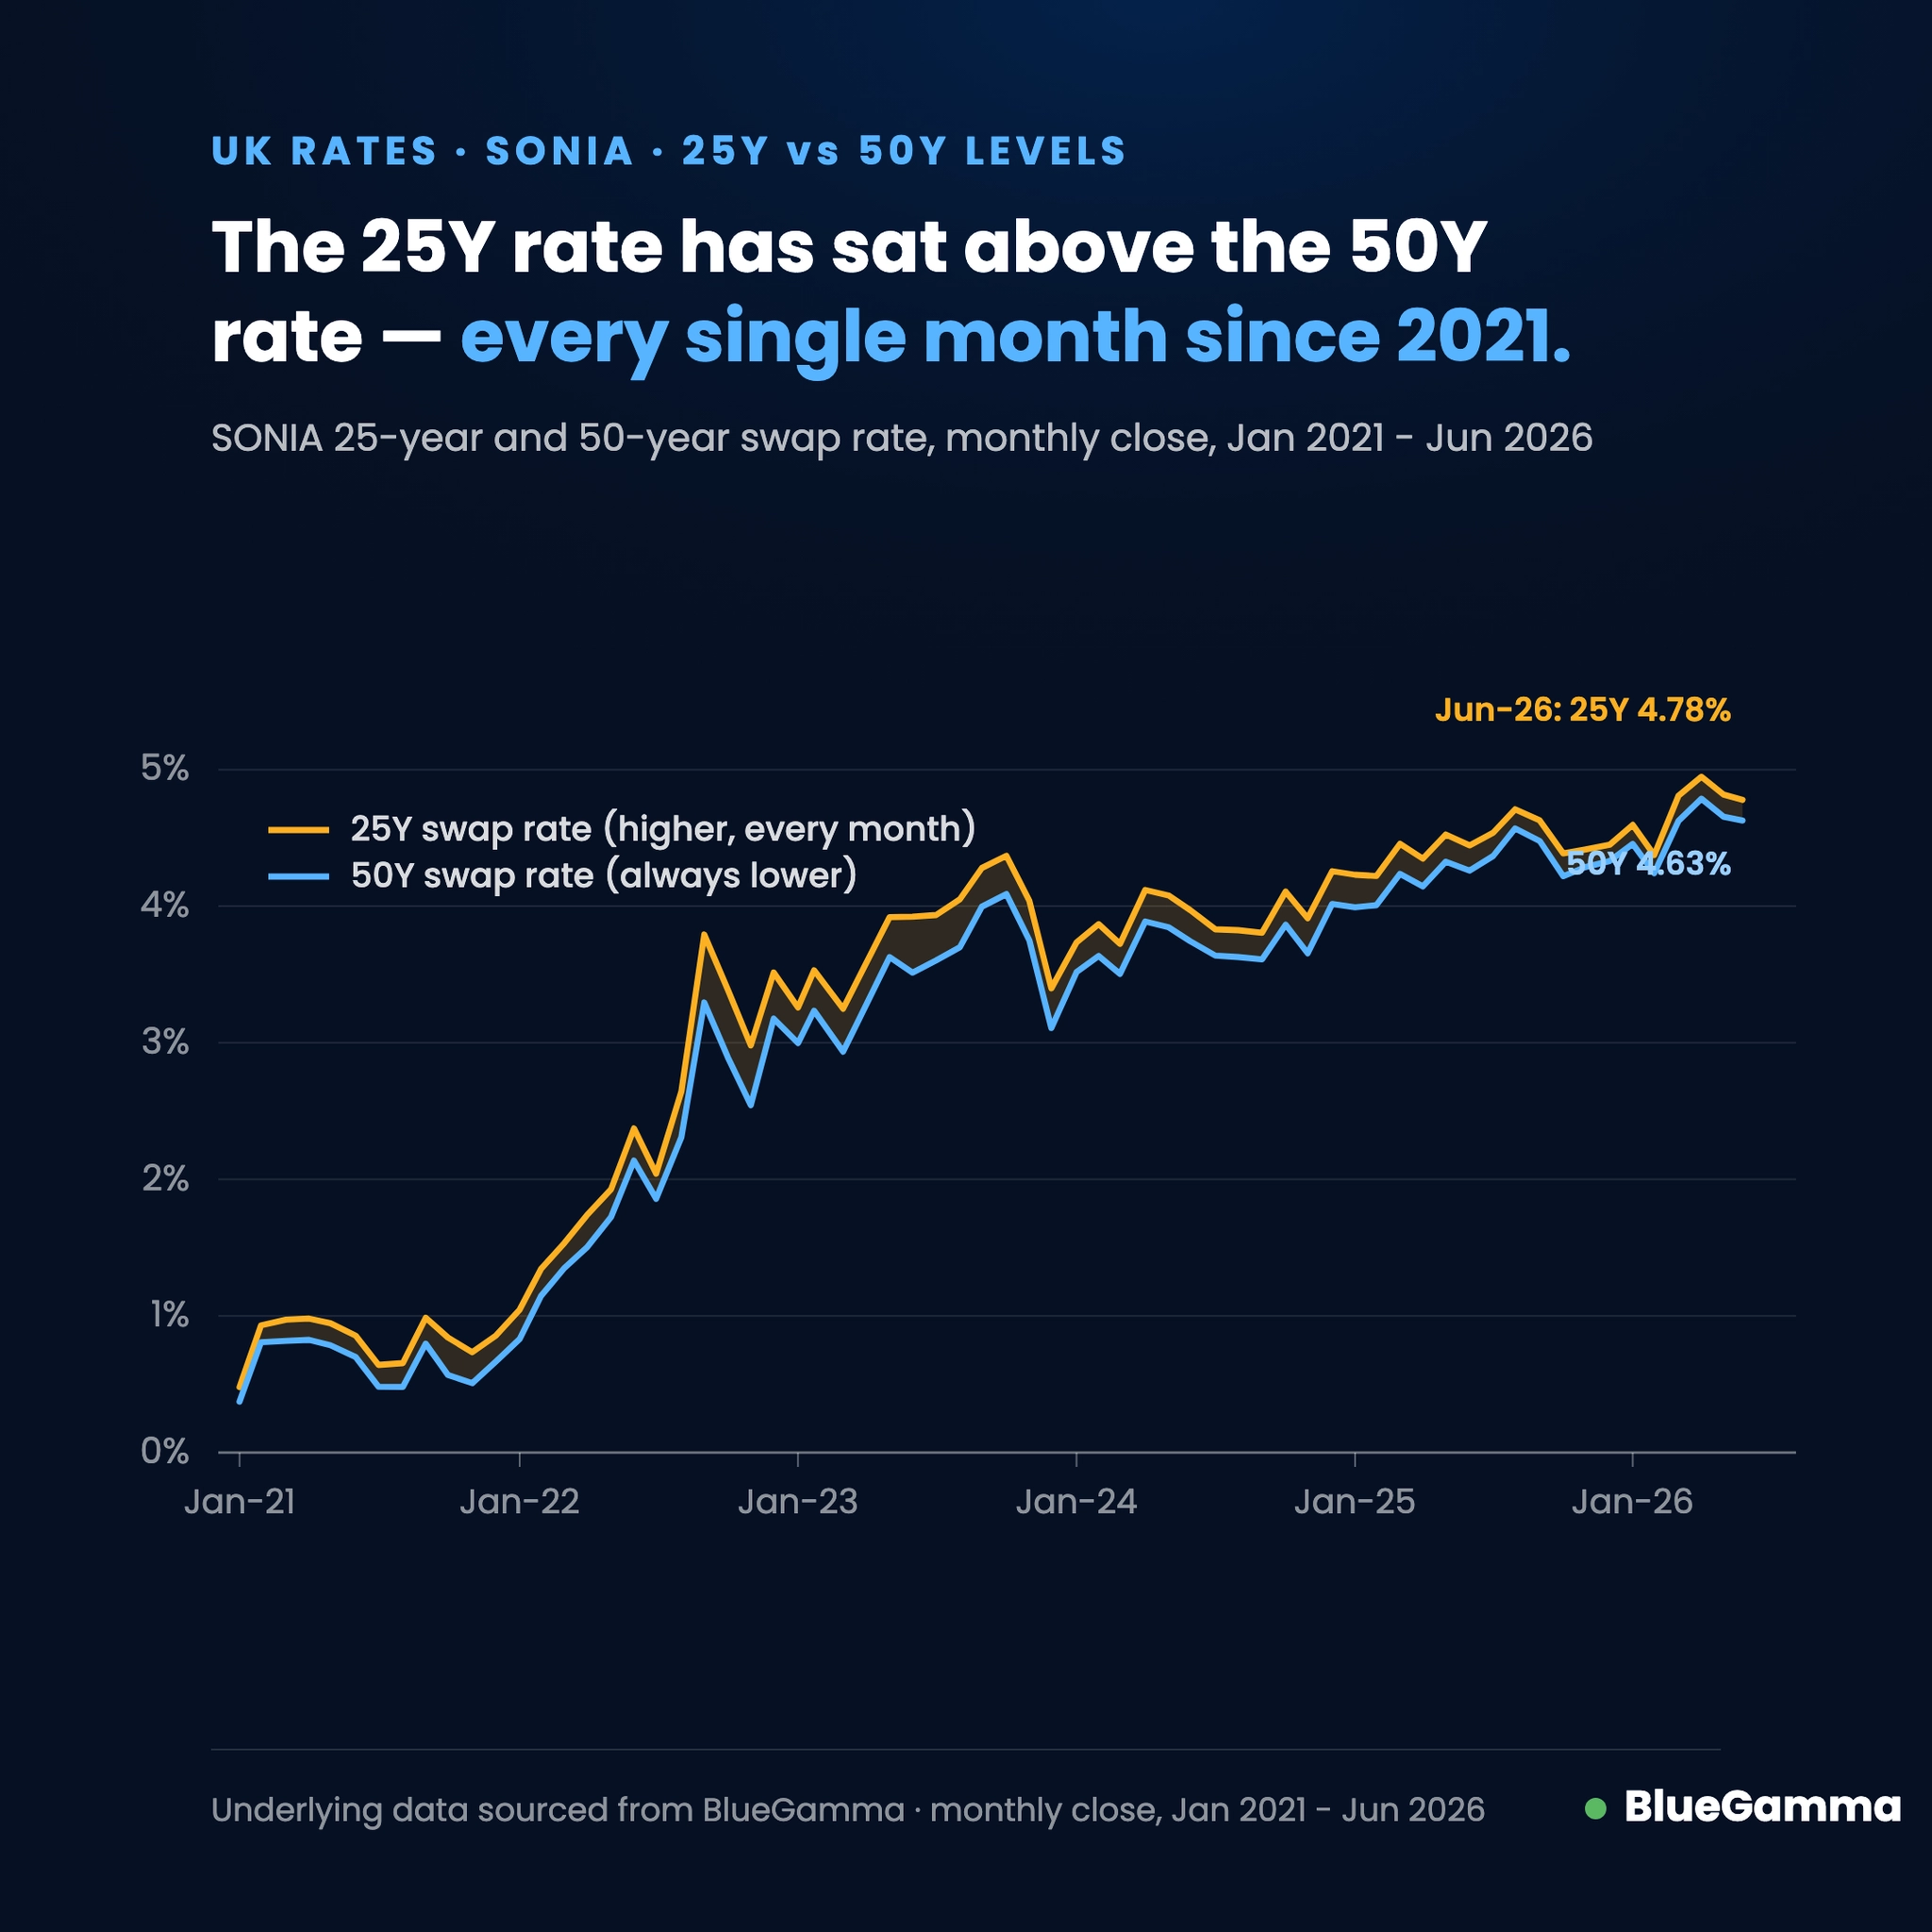
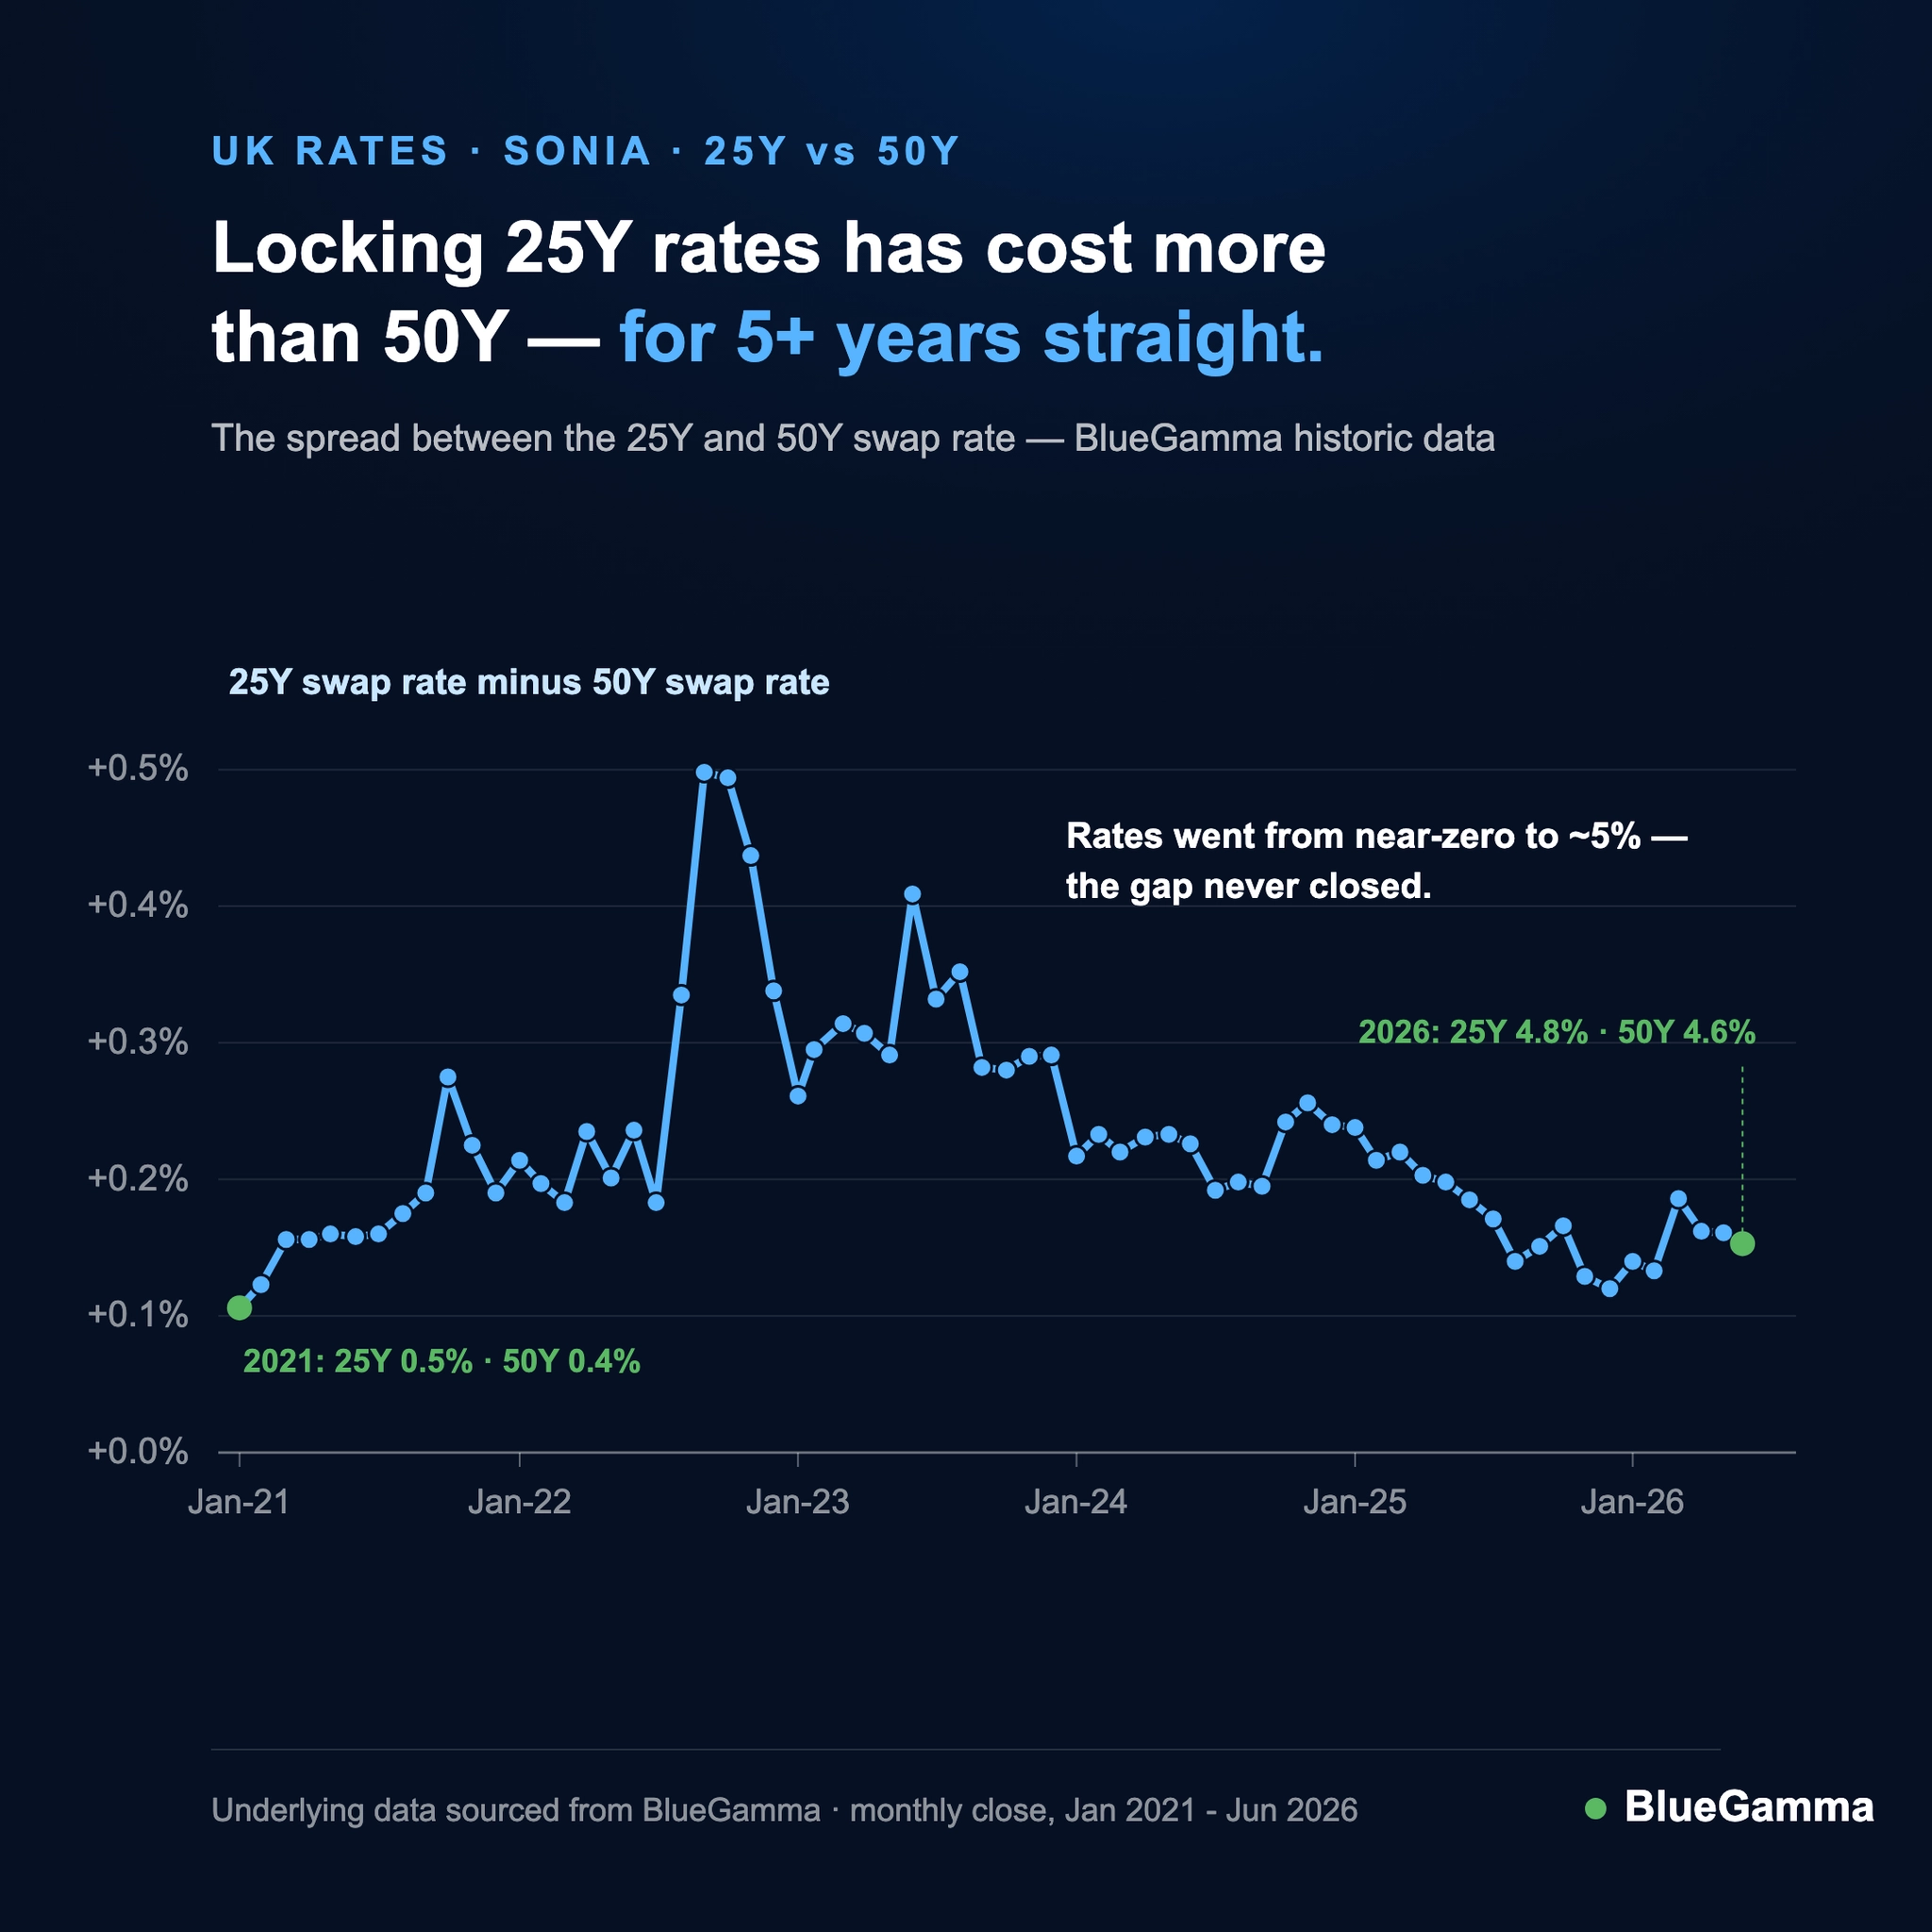
And the backdrop over those five years could hardly have been more different. In early 2021 the 25-year rate was about 0.5%, in a near-zero world. Today it is about 4.8%. Rates climbed from the floor to nearly 5% — and the gap never closed. It just sat there, quietly, averaging around +0.2% the entire way.
| Metric | Value |
|---|---|
| Months studied | 66 — Jan 2021 to Jun 2026 |
| Months the 25Y exceeded the 50Y | 66 (100%) |
| Smallest gap | +0.11% (Jan 2021) |
| Largest gap | +0.50% (Sep 2022) |
| Average gap | +0.23% |
| 25Y rate over the period | 0.48% → 4.78% |
Want the underlying numbers? Download the full monthly 25Y / 50Y dataset (CSV) →
Why: a uniquely British force
This isn't a forecast about where rates are heading. It's structural — and it's distinctly British.
UK pension funds and liability-driven investment (LDI) strategies have obligations that stretch decades into the future. To match those liabilities, they need the longest-dated assets they can find — 30-, 40-, 50-year exposure. That demand is steady and relatively price-insensitive, and it pushes the very-long end of the curve below the 25-year peak.
You don't see this to the same degree in the US dollar or euro curves, where the structural pull for ultra-long duration is weaker.
It's worth separating the two ends of the curve. The Bank of England held Bank Rate at 3.75% on 17 June 2026 — a 7–2 vote, with two members wanting a hike — and the next decision is 30 July. That's a short-end story. The part of the curve that prices 25-, 40- and 50-year funding marches to a different drum entirely: pension demand, not the next meeting.
What it means if you're financing long-dated assets
If you're sizing long-dated infrastructure or project finance, the cheapest maturity may not be the one you'd instinctively reach for. The 50-year point can be better value than the 25- or 30-year — and that relationship has been remarkably stable.
The wider lesson: the swap curve gives you the headline number, but its shape tells you where the value is. Reading it well is worth real basis points.
See it for yourself. Pull live SONIA, SOFR and €STR curves, price a swap, and download history — on the web, in Excel, or via API.
Underlying current and historic interest rate data sourced from BlueGamma. Rates are mid-market SONIA swaps, monthly close, Jan 2021 – Jun 2026.