Looking for a MtM Calculator?
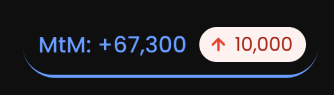
Monitor the current MtM of your entire portfolio, updated in real-time.
Travel back in time to see how the MtM of your swaps has evolved.
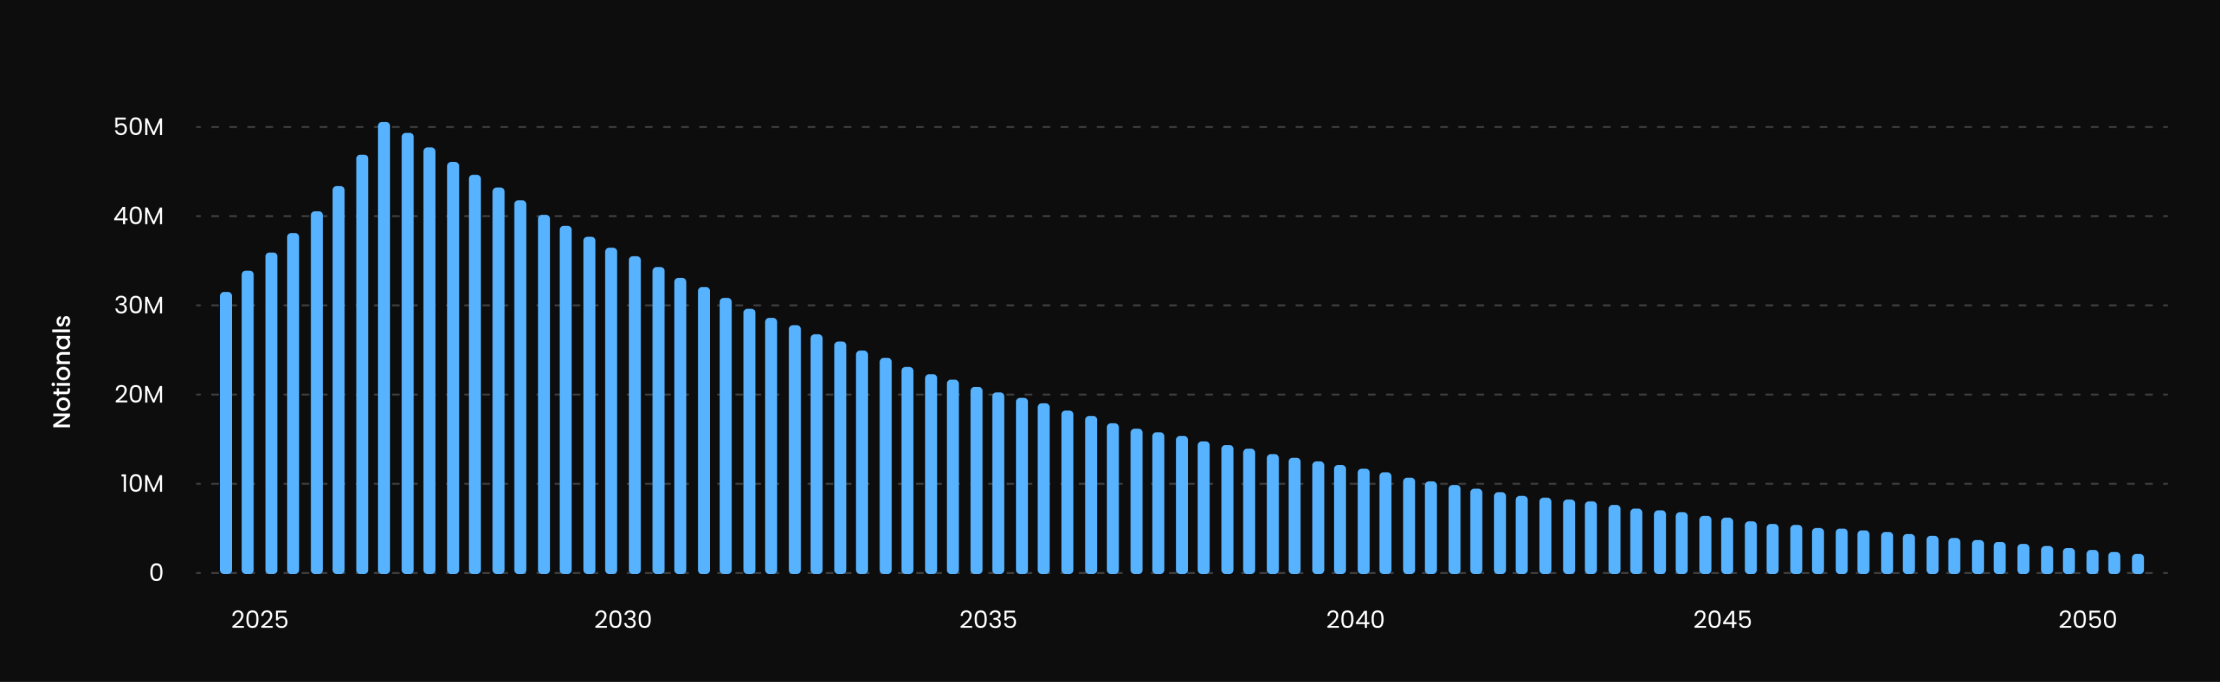
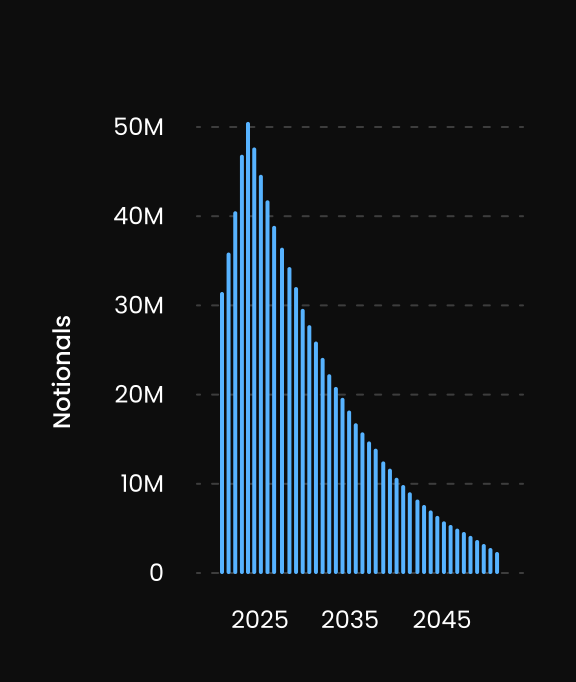
Forecast the future MtM of your swap portfolio and stay ahead of market movements.
Calculate MtMs for 20+ currencies including EURIBOR, SOFR, and SONIA.
Access real-time market data updated every 5 minutes.
Share projects across the team for better collaboration
trusted by

See it in practice
Real tasks this feature was built for, from the use-case library.
"The auditor wants an independent valuation of our swap"
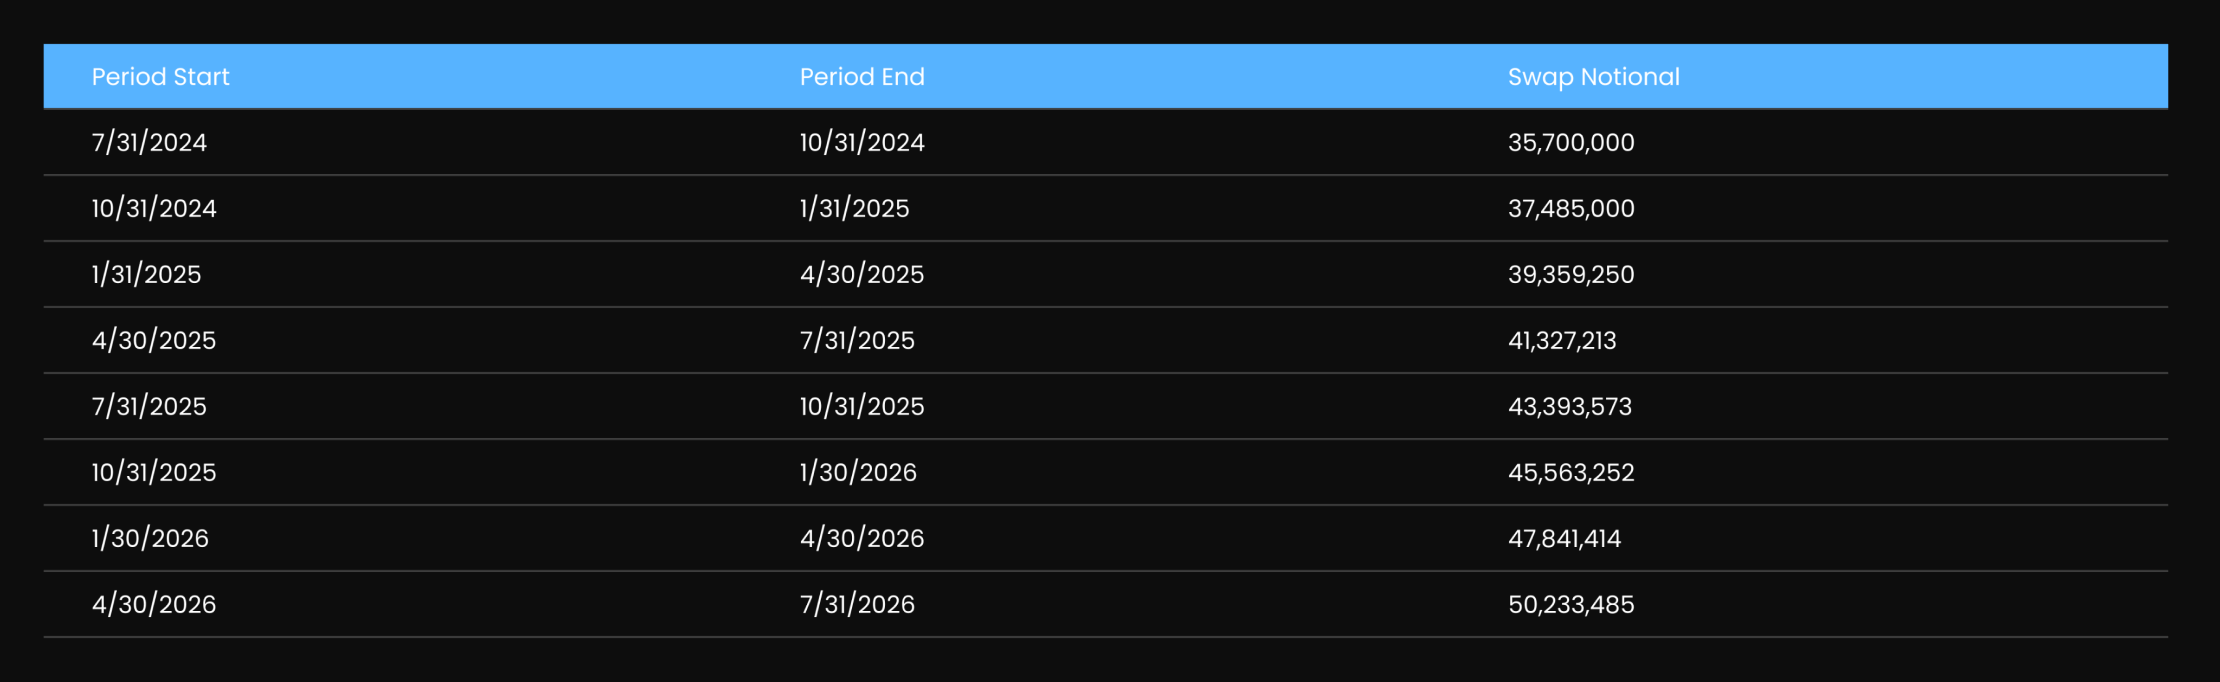
Set up the swap once (amortising supported) and get a monthly mark-to-market, PV01 and a downloadable valuation report your auditor will accept.
See how →"We're refinancing — what's the breakage on the existing swap?"
Load the existing swap to see its live mark-to-market and how breakage evolves over time, so you can negotiate the exit or time the refinancing yourself.
See how →"I run a book of swaps — which payments settle this week, and are the amounts right?"
See every swap cashflow falling due in the next 48 hours across your whole book, with amounts confirmed the moment the floating rate fixes — so treasury can check the number and line up cash before it settles.
See how →