Custom Dashboards:
Your Rates, Curves & Swaps Data All in One Place
No more clicking around: Stop digging through tabs and stale screenshots.
Create a single view of the rates and curves that matter to you most, monitor the market in one place.
Save Time: No More Repeated Setups
Birds Eye View: One Consolidated View, Always Up-to-Date
Easy Downloads: Download Data from Key Widgets
Trusted by
What You Can Do With Custom Dashboards
Every day, financial modellers, treasury teams, and analysts waste time repeating the same workflows:
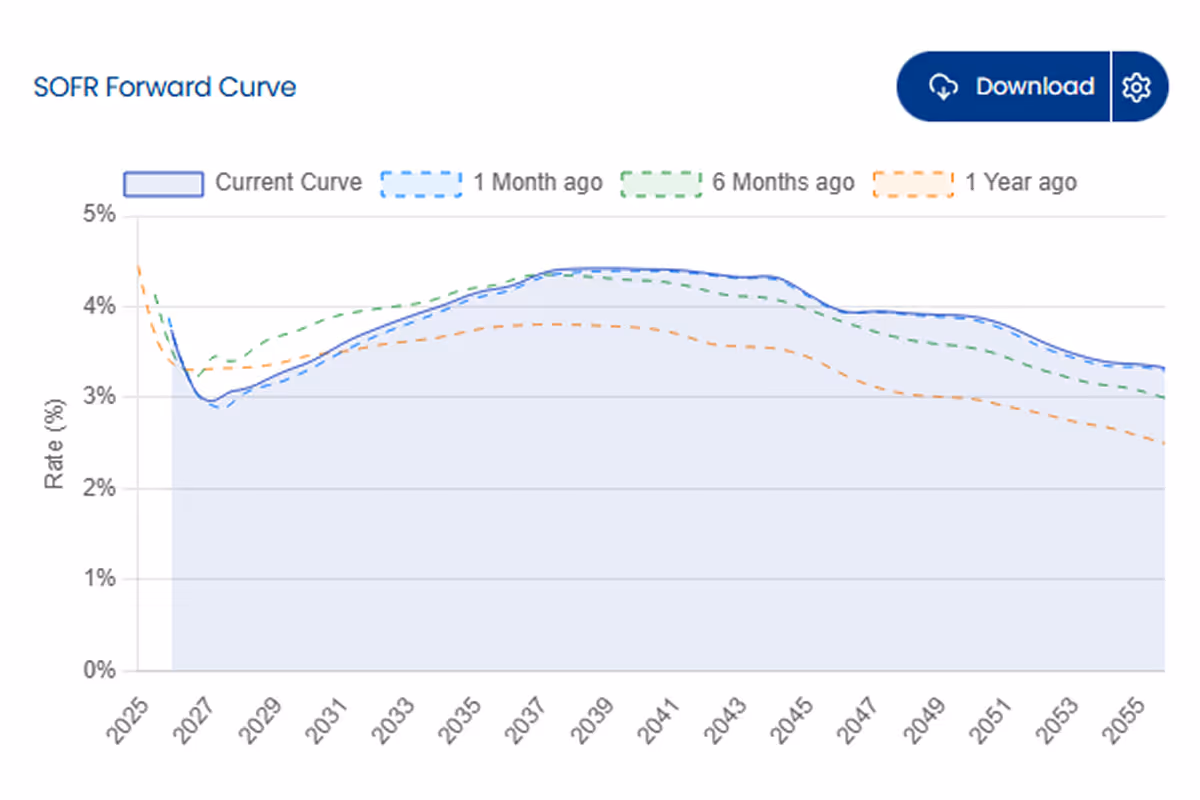
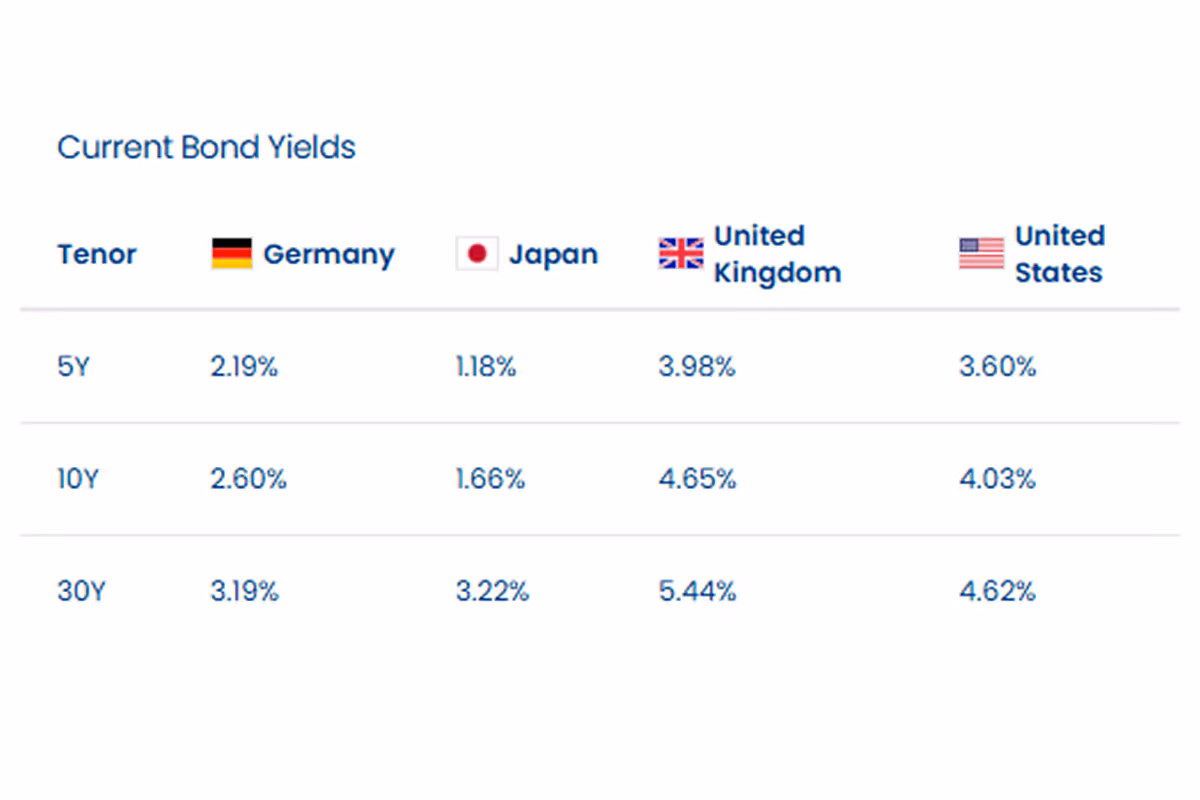
Pulling Forward Curves
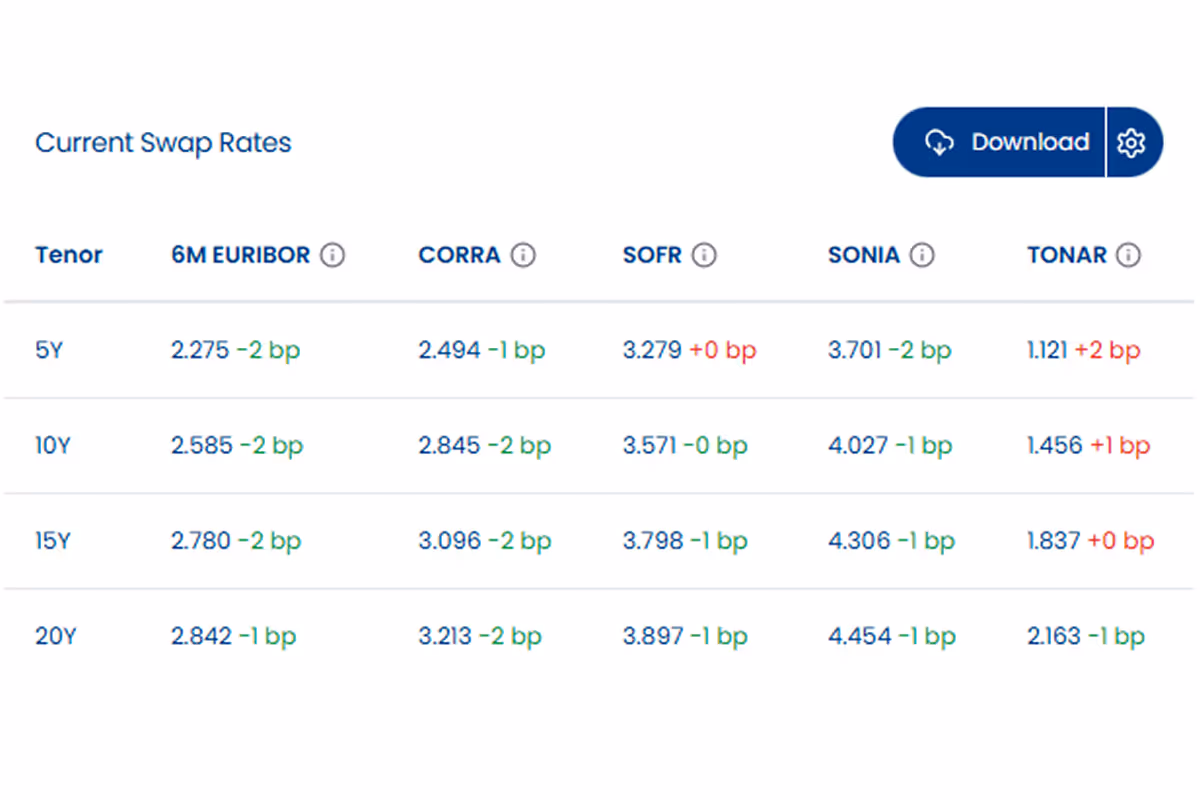
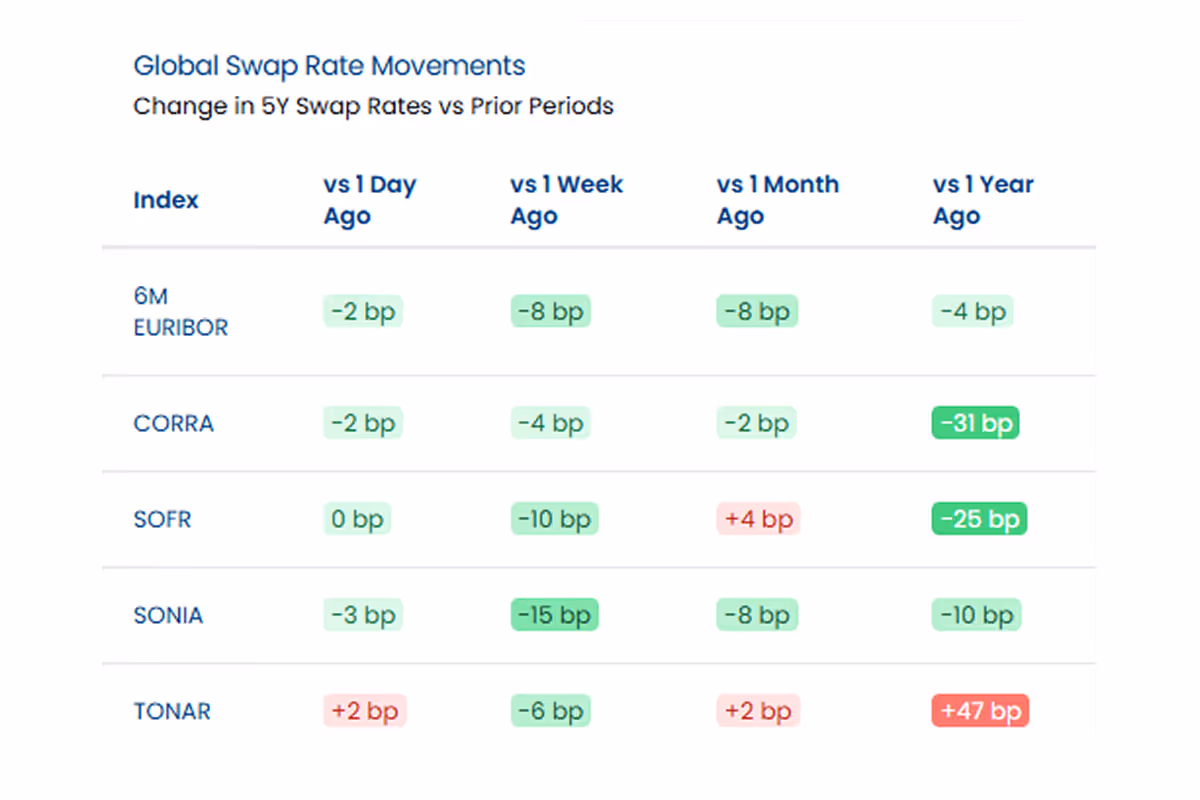
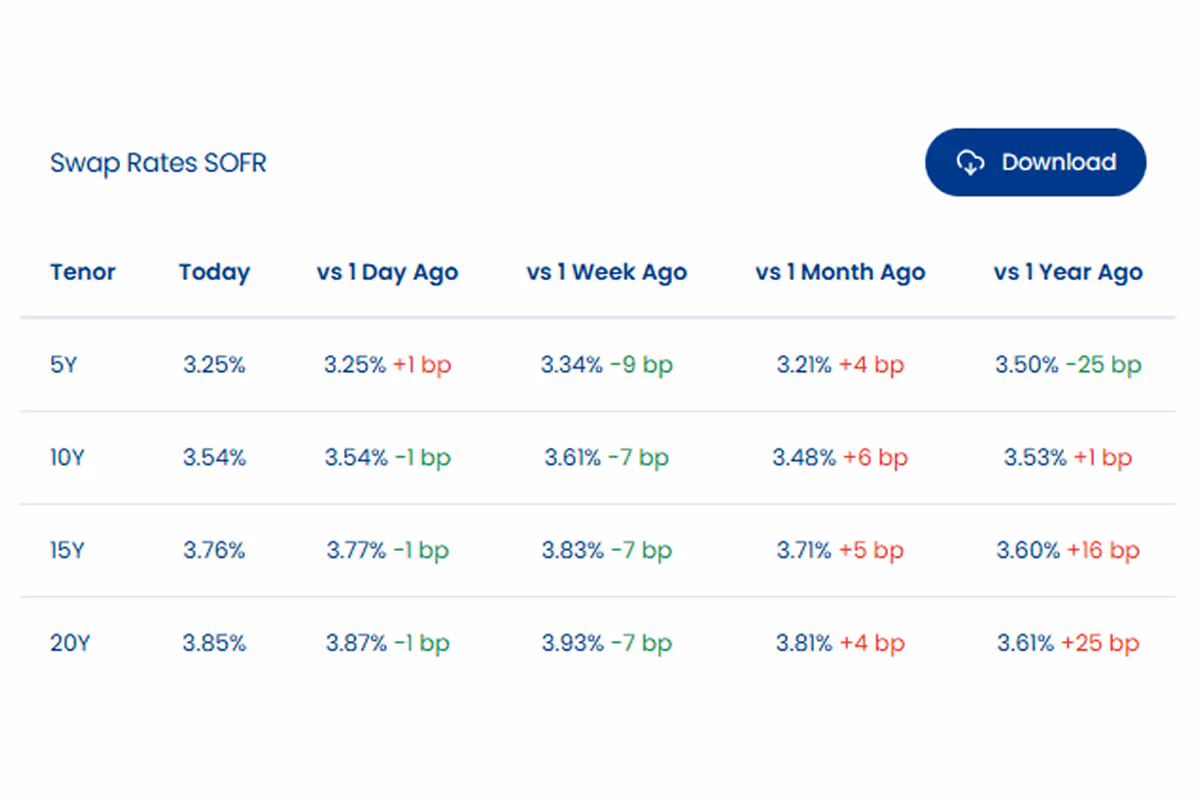
Checking Swap Rates
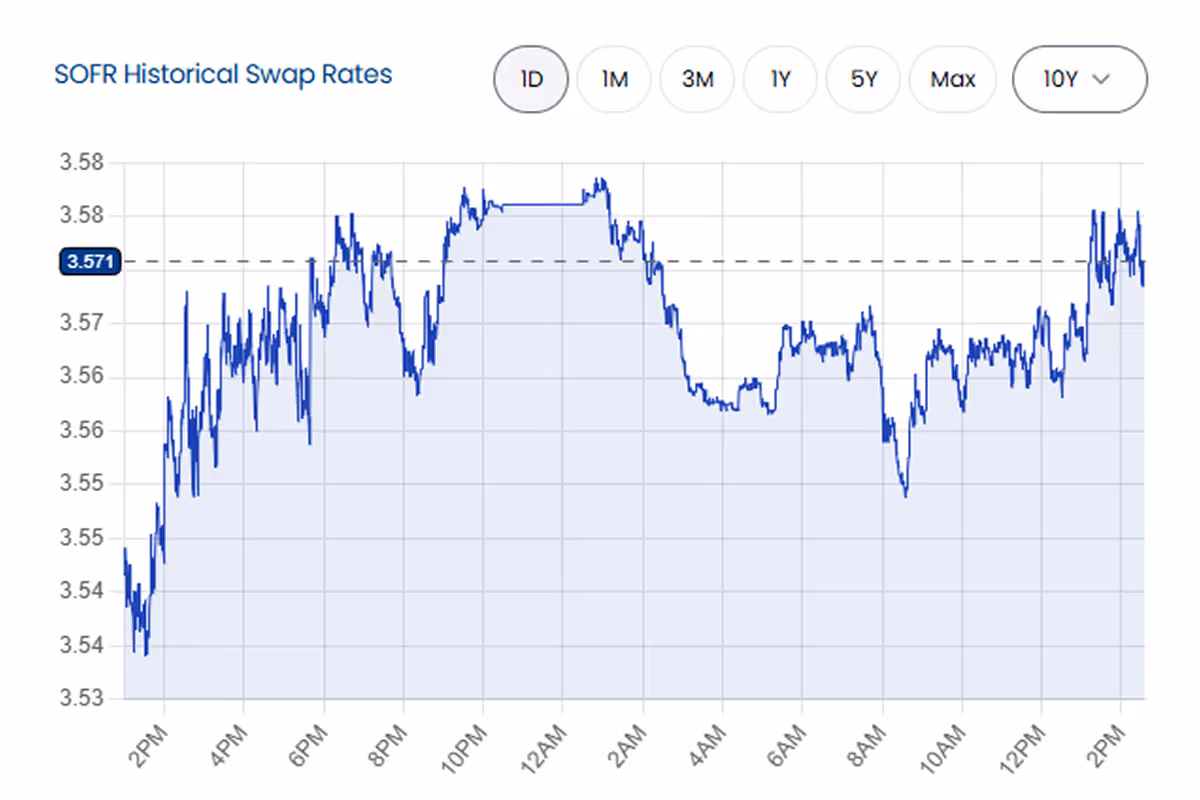
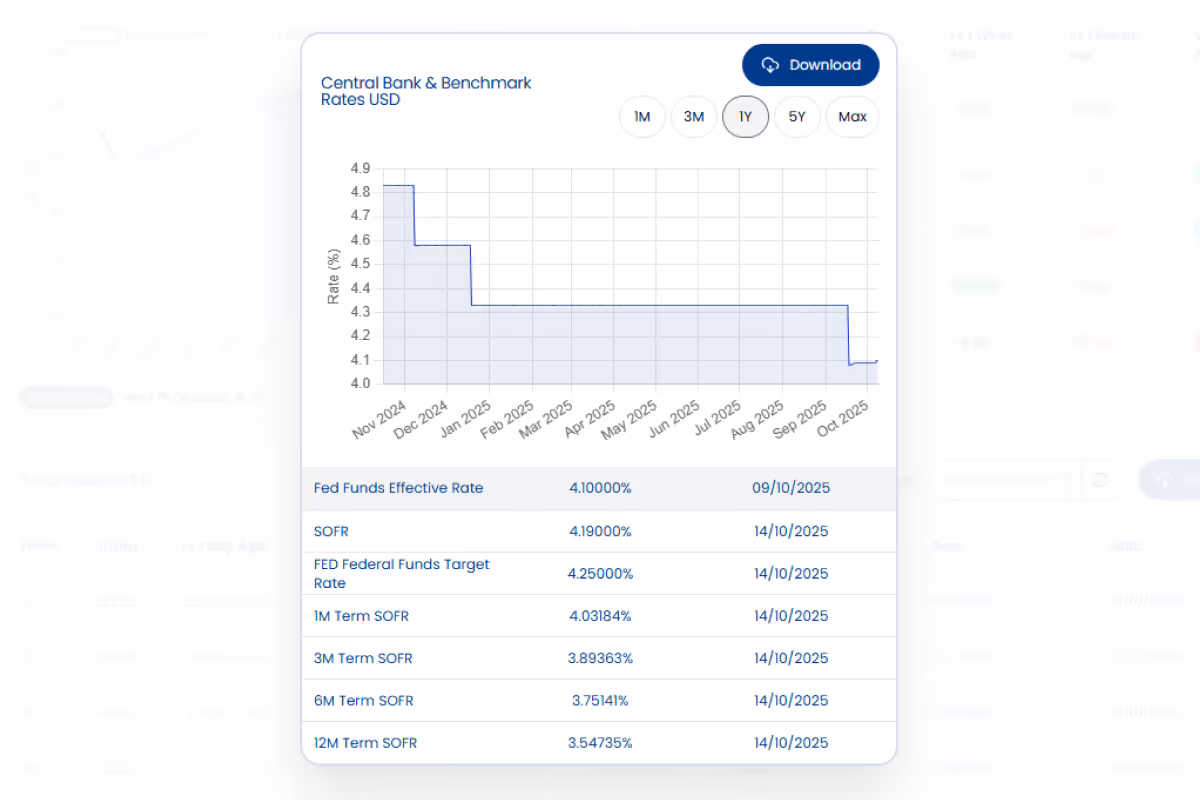
Track Market Moves
Now you don’t have to waste time repeating the same steps every time.
Build a Custom Dashboard from a range of widgets
Choose from a growing library of widgets to build your perfect market view.
Try building your own Custom Dashboard
Its super easy to quickly build a Custom Dashboard to get all of your Curves and Swap Rates data in one place.
Customise Your Dashboard’s Layout
Choose from a growing library of widgets to build your perfect market view.
Download Data from Widgets Easily
Easily download data from Key widgets, saving you time from having to find the right page.
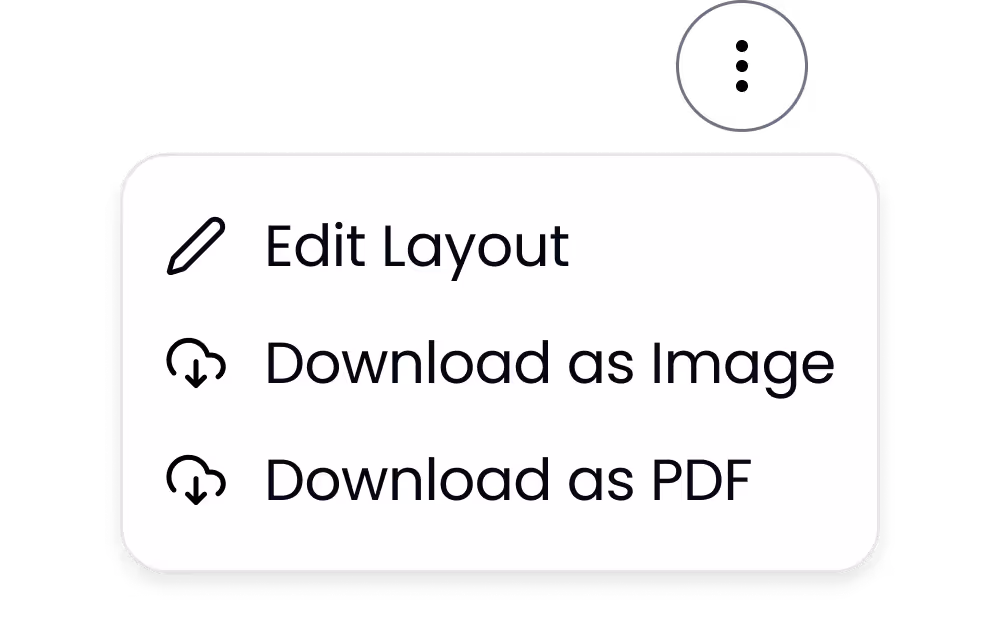
Download Your Whole Dashboard as an Image or PDF
Export your whole dashboard as a PDF or Image, allowing you to quickly and easily share your view.
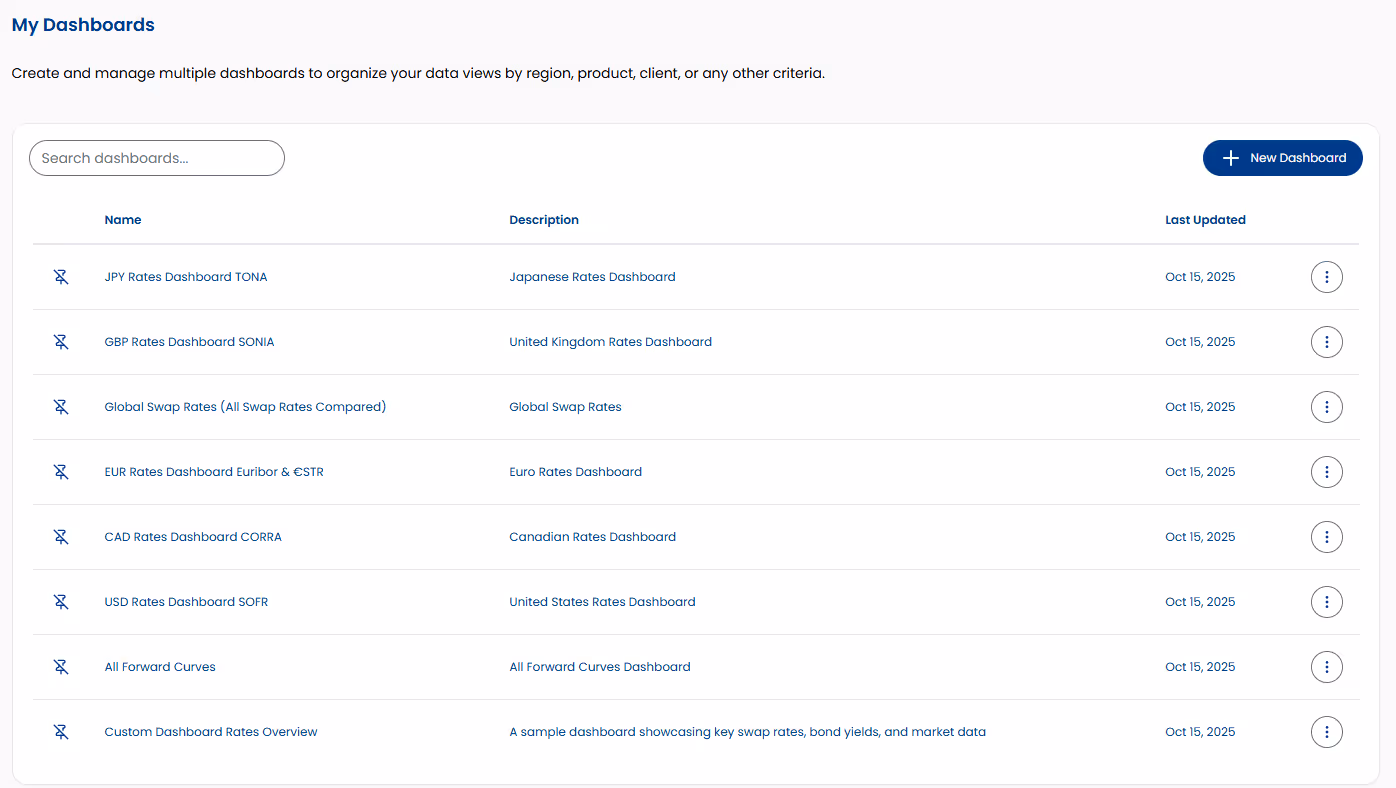
Create Multiple Dashboards
Compose multiple Dashboards, enabling you to easily switch between different market views or projects.
How to Create a Custom Dashboard
Its super simple to create a Custom Dashboard.
Here’s a quick walkthrough on how to do it.
Click “New Dashboard”
Enter a Name & Description for the Dashboard
Add Widgets
Save Layout