Ready to integrate forward curves directly into your workflows? This guide will show you how to fetch forward rates using Python and the BlueGamma API.
Step 1: Set Up Your Environment
Before we begin, ensure that you have Python installed along with the requests and matplotlib libraries. If you don't have them yet, install them using:
pip install requests matplotlib
Step 2: Fetch SOFR Forward Rates
The /forward_rate endpoint in the BlueGamma API lets you fetch forward rates for specific start dates and tenors. Let's start with an example for a single date:
import requests

# API endpoint
url = "https://api.bluegamma.io/v1/forward_rate"

# Query parameters for a single forward rate
querystring = {
    "index": "SOFR",            # Reference rate
    "start_date": "2025-06-30", # Start date
    "end_date": "3M"            # Fixed tenor of 3M
}

# API headers (replace 'YOUR_API_KEY' with your actual API key)
headers = {"X-Api-Key": "YOUR_API_KEY"}

# Fetch the forward rate
response = requests.get(url, headers=headers, params=querystring)
if response.status_code == 200:
    data = response.json()
    print("Forward Rate:", data["forward_rate"])
else:
    print("Error:", response.status_code, response.text)
The script fetches the 3-month SOFR forward rate starting on 2025-06-30. The response includes the forward rate and other relevant details.
Step 3: Build a SOFR Forward Curve
Now, let's expand this to fetch forward rates for a set of pre-definded dates. By doing so, we'll plot a SOFR forward curve to visualise how the rate evolves over time.
import requests
import matplotlib.pyplot as plt

# API endpoint
url = "https://api.bluegamma.io/v1/forward_rate"

# Define predefined start dates (end of June and December each year)
start_dates = [
    "2025-06-30", "2025-12-31",
    "2026-06-30", "2026-12-31",
    "2027-06-30", "2027-12-31",
    "2028-06-30", "2028-12-31",
    "2029-06-30", "2029-12-31",
    "2030-06-30", "2030-12-31"
]

# Fixed tenor (3M)
tenor = "3M"
forward_rates = []  # To store forward rates

# API headers (replace 'YOUR_API_KEY' with your actual API key)
headers = {"X-Api-Key": "YOUR_API_KEY"}

# Fetch forward rates for each predefined start date
for start_date in start_dates:
    querystring = {
        "index": "SOFR",            # Reference rate
        "start_date": start_date,   # Start of forward period
        "end_date": tenor           # Fixed tenor of 3M
    }

    response = requests.get(url, headers=headers, params=querystring)
    if response.status_code == 200:
        data = response.json()
        forward_rates.append(data["forward_rate"])  # Append the forward rate
    else:
        print(f"Error fetching data for start date {start_date}: {response.status_code}")
        forward_rates.append(None)  # Add a placeholder for missing data

# Plot the 3M forward curve
plt.figure(figsize=(12, 6))
plt.plot(start_dates, forward_rates, marker='o', linestyle='-', color='blue', label='3M SOFR Curve')

# Customize the plot
plt.title('3M SOFR Forward Curve (2025-2030)', fontsize=16)
plt.xlabel('Start Date', fontsize=12)
plt.ylabel('Forward Rate (%)', fontsize=12)
plt.xticks(rotation=45)  # Rotate x-axis labels for readability
plt.grid(True, linestyle='--', alpha=0.7)
plt.legend(fontsize=10)
plt.tight_layout()

# Display the graph
plt.show()
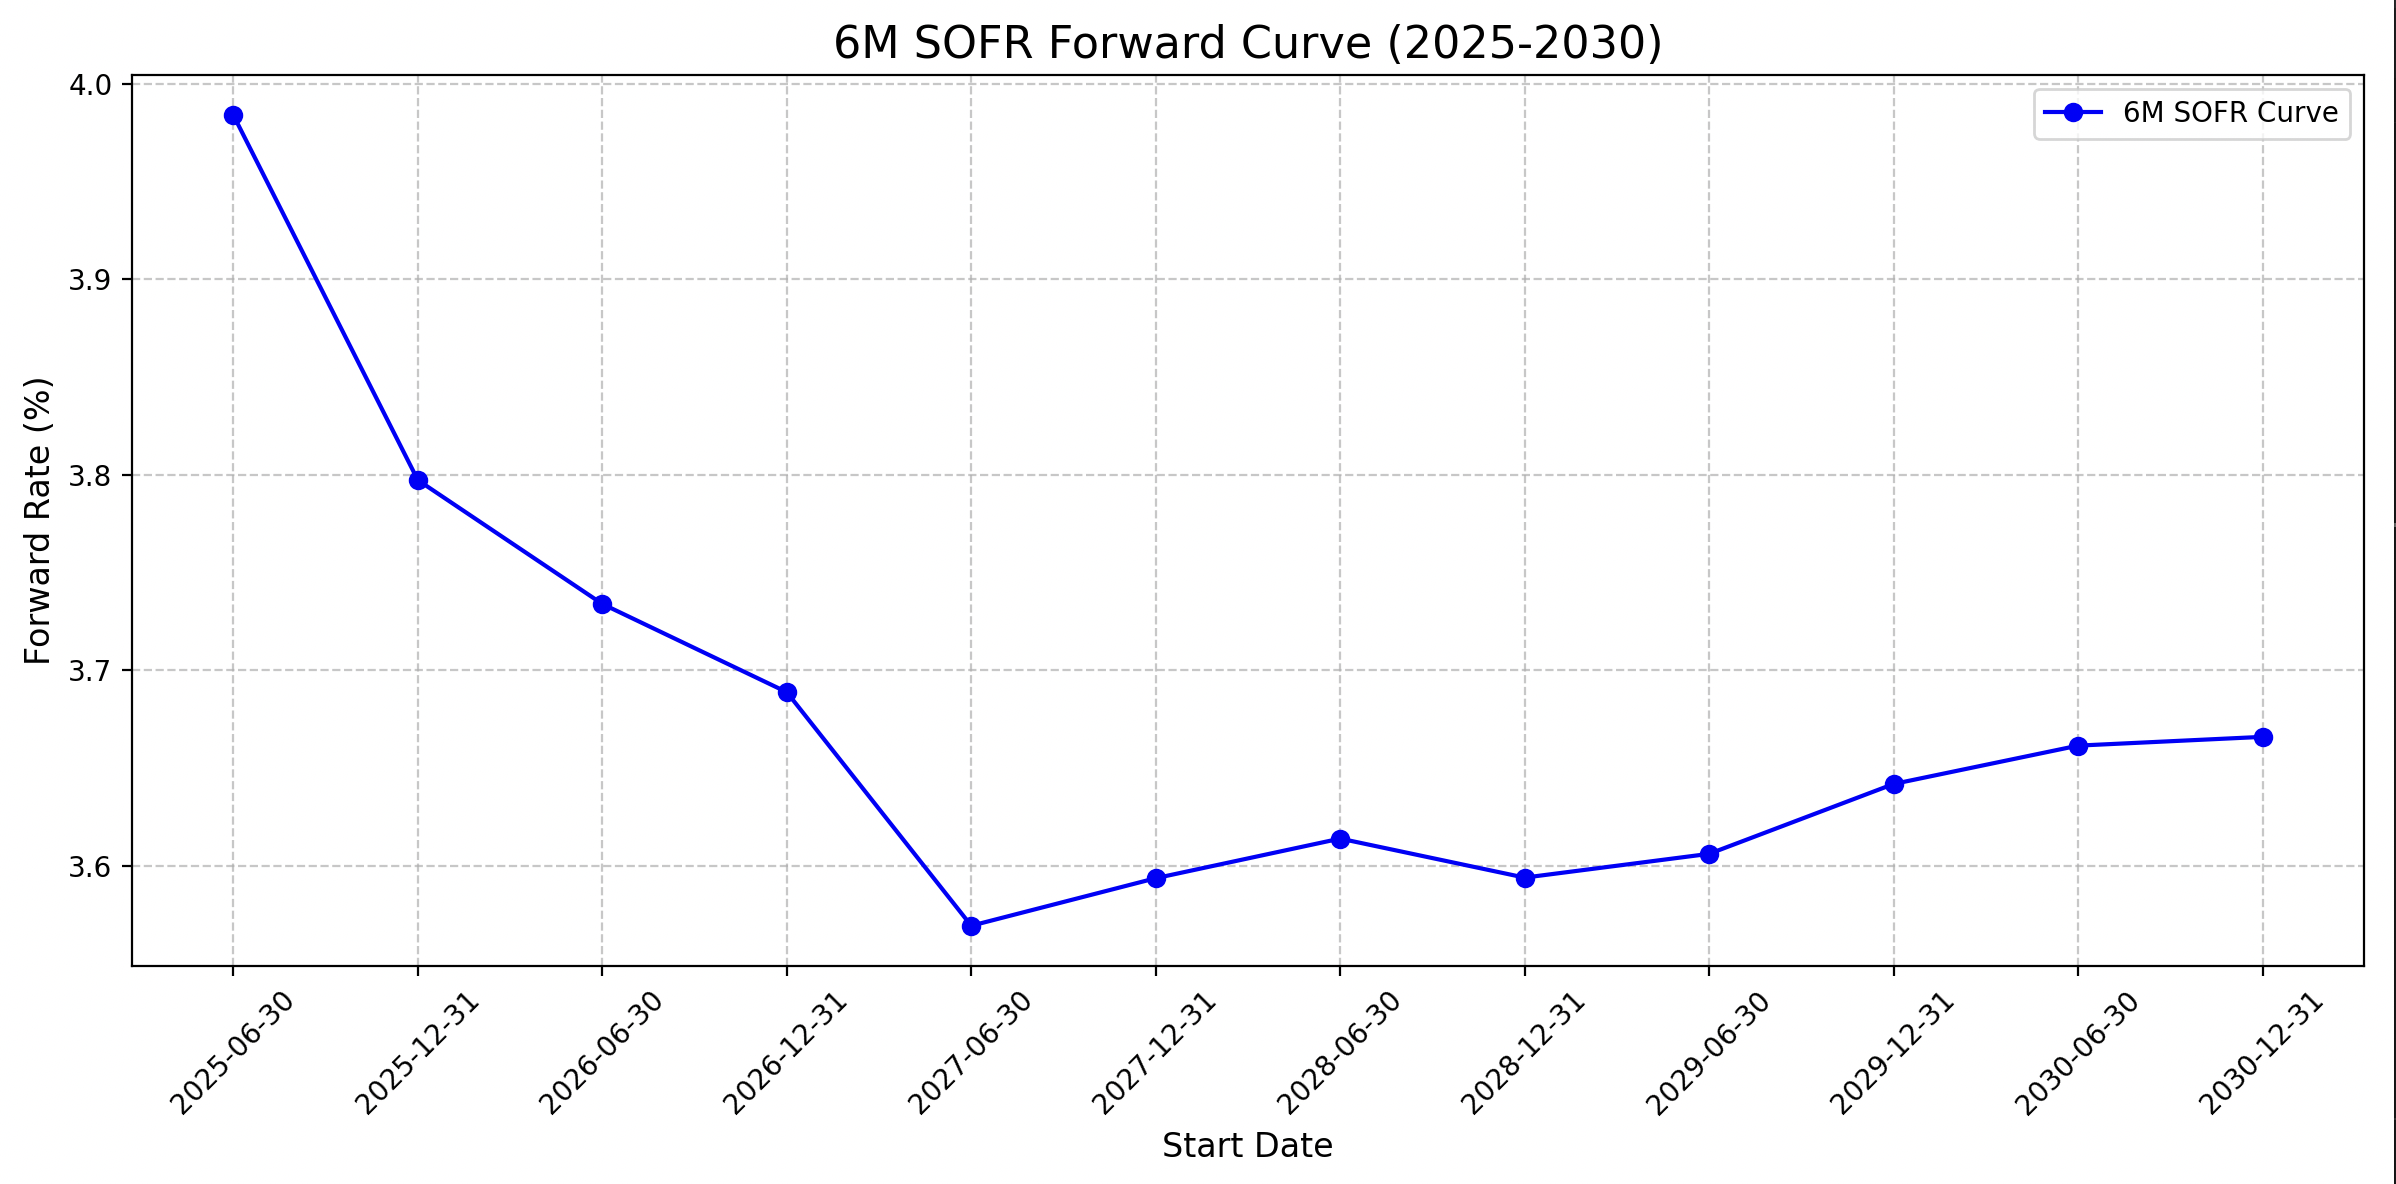
Step 4: Understand the Output
The graph plots the 6-month SOFR forward curve with:
- x axis: Predefined start dates
- y-axis: forward rates for 6M compounded SOFR
Try it Yourself!
Whether you're forecasting interest costs or performing valuations, the BlueGamma API makes it easy to fetch real-time swap rates and build forward curves. Request access to the API here.
Check out our other API tutorials on Euribor API and CORRA API.