For treasury teams, quant developers and risk managers, the FX forward curve is an essential tool for pricing derivatives and managing currency risk. Aggregating reliable forward exchange rates across specific future dates often requires complex integrations or expensive data terminals.
With the BlueGamma API, you can programmatically access forward forex rates for any date and construct precise forex forward curves in seconds, enabling better visualisation of market expectations and interest rate differentials over medium-to-long horizons.
Check our full API Documentation here.
Visualising the FX Forward Curve via our API
Constructing a forex forward curve involves plotting the forward exchange rate against time. With our API, you don't need to download bulk CSVs. Instead, you can pinpoint the exact maturities you need and visualise the curve immediately.
The Request Logic
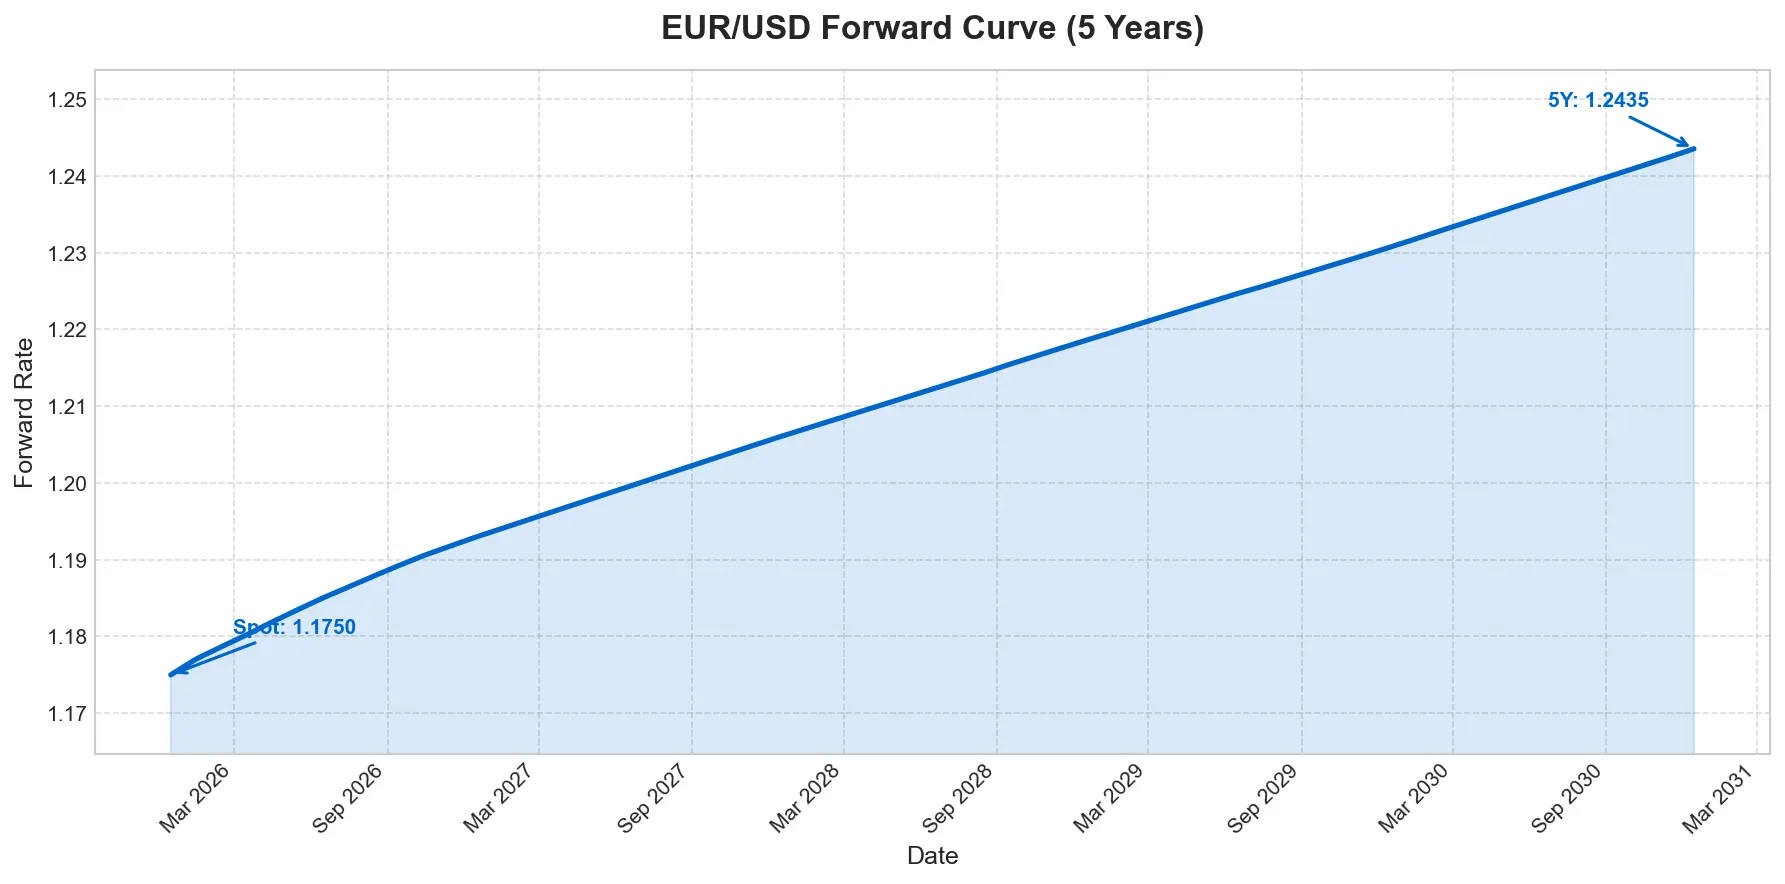
To build a forex forward curve for EUR/USD, we define a reusable function to fetch forward forex rates, iterate through a standard schedule (Spot to 5 Years with monthly points, although daily granularity is also possible) and then plot the results.
GET Request Format: https://api.bluegamma.io/v1/fx_forward?currency_pair=EURUSD&date=2030-06-01
Python Implementation
import requests
import matplotlib.pyplot as plt
import pandas as pd
from datetime import date, timedelta
import matplotlib.dates as mdates

API_KEY = "YOUR_API_KEY"
BASE_URL = "https://api.bluegamma.io/v1/fx_forward"

def get_forward_rate(pair: str, target_date: str, api_key: str) -> float | None:
    """Fetch the FX forward rate for a specific date."""
    params = {"currency_pair": pair, "date": target_date}
    headers = {"x-api-key": api_key}

    response = requests.get(BASE_URL, params=params, headers=headers)

    if response.status_code == 200:
        return response.json()["rate"]

    print(f"Error: {response.status_code} - {response.text}")
    return None


def plot_5y_curve(pair: str, start_date: date):
    """Generate a 5-year forward curve with monthly granularity."""
    data = []

    print(f"Fetching {pair} forward curve (Spot to 5Y)...")
    print("-" * 40)
    print(f"{'Tenor':<6} | {'Date':<12} | {'Rate':<10}")
    print("-" * 40)

    for i in range(61):  # 0 = Spot, 1-60 = monthly points
        if i == 0:
            label, target = "Spot", start_date
        else:
            label = f"{i}M"
            target = start_date + timedelta(days=int(i * 30.44))

        rate = get_forward_rate(pair, target.isoformat(), API_KEY)

        if rate:
            print(f"{label:<6} | {target} | {rate:.5f}")
            data.append({"Date": target, "Rate": rate})

    print("-" * 40)

    # Visualise
    df = pd.DataFrame(data)
    plt.figure(figsize=(12, 6))
    plt.plot(df["Date"], df["Rate"], linewidth=2, color="#007acc")
    plt.title(f"{pair} Forward Curve (5 Years)")
    plt.xlabel("Date")
    plt.ylabel("Forward Rate")
    plt.gca().xaxis.set_major_formatter(mdates.DateFormatter("%Y"))
    plt.gca().xaxis.set_major_locator(mdates.YearLocator())
    plt.grid(True, linestyle="--", alpha=0.7)
    plt.tight_layout()
    plt.show()


if __name__ == "__main__":
    plot_5y_curve("EURUSD", date.today())
Terminal Output:
Fetching monthly data for EURUSD (Spot to 5Y)...
Tenor | Date | Rate
Spot | 2025-12-03 | 1.16593
1M | 2026-01-02 | 1.16787
2M | 2026-02-01 | 1.16966
3M | 2026-03-04 | 1.17129
4M | 2026-04-03 | 1.17308
5M | 2026-05-04 | 1.17463
6M | 2026-06-03 | 1.17623
7M | 2026-07-04 | 1.17782
8M | 2026-08-03 | 1.17926
….
57M | 2030-09-03 | 1.23278
58M | 2030-10-03 | 1.23381
59M | 2030-11-02 | 1.23484
60M | 2030-12-03 | 1.23597
EUR/USD Forward Curve Visualisation
Why This Works
| Benefit | Description |
|---|---|
| Precision | Request dates years into the future for accurately modelling and hedging long-term costs. |
| Modularity | Fetching logic is fully decoupled from plotting, making it easy to integrate directly into pricing engines and internal systems. |
| Lightweight | Returns clean JSON output, minimising processing overhead even for multi-year FX forward curves. |
Multi-Currency Forward Curves Comparison
Global portfolios rarely rely on a single currency pair. Our API allows you to scale this logic instantly across major pairs to compare forward points and interest rate differentials over a 5-year horizon or longer.
The Request Logic
We can reuse our get_forward_rate function to compare multiple currencies (e.g., EUR/USD, GBP/USD, AUD/USD) on a single chart. This highlights the expectations for exchange rates over time in the future.
Python Implementation
def plot_majors_5y(start_date: date):
    """Compare 5-year forward curves for major currency pairs."""
    pairs = ["EURUSD", "GBPUSD", "AUDUSD", "NZDUSD", "USDCAD", "USDCHF", "EURGBP"]
    time_points = [0, 365, 365*2, 365*3, 365*4, 365*5]
    labels = ["Spot", "1Y", "2Y", "3Y", "4Y", "5Y"]

    plt.figure(figsize=(12, 8))

    for pair in pairs:
        rates = []
        print(f"Processing {pair}...")

        for days, label in zip(time_points, labels):
            target = (start_date + timedelta(days=days)).isoformat()
            rate = get_forward_rate(pair, target, API_KEY)

            if rate:
                print(f"  {label:<5}: {rate:.5f}")
                rates.append(rate)

        if len(rates) == len(labels):
            plt.plot(labels, rates, marker="o", label=pair)

    plt.title("Major Currencies: 5-Year Forward Curve Comparison")
    plt.xlabel("Tenor")
    plt.ylabel("Forward Rate")
    plt.legend(bbox_to_anchor=(1.05, 1), loc="upper left")
    plt.grid(True, alpha=0.5)
    plt.tight_layout()
    plt.show()


if __name__ == "__main__":
    plot_majors_5y(date.today())
Terminal Output:
Processing EURUSD...
  Spot : 1.17491
  1Y   : 1.19287
  2Y   : 1.20599
  3Y   : 1.21845
  4Y   : 1.23069
  5Y   : 1.24350

Processing GBPUSD...
  Spot : 1.33848
  1Y   : 1.33659
  2Y   : 1.33274
  3Y   : 1.32900
  4Y   : 1.32573
  5Y   : 1.32289

Processing AUDUSD...
  Spot : 0.66504
  1Y   : 0.66241
  2Y   : 0.65629
  3Y   : 0.65046
  4Y   : 0.64459
  5Y   : 0.63854

Processing USDCHF...
  Spot : 0.79580
  1Y   : 0.76714
  2Y   : 0.74247
  3Y   : 0.71921
  4Y   : 0.69683
  5Y   : 0.67492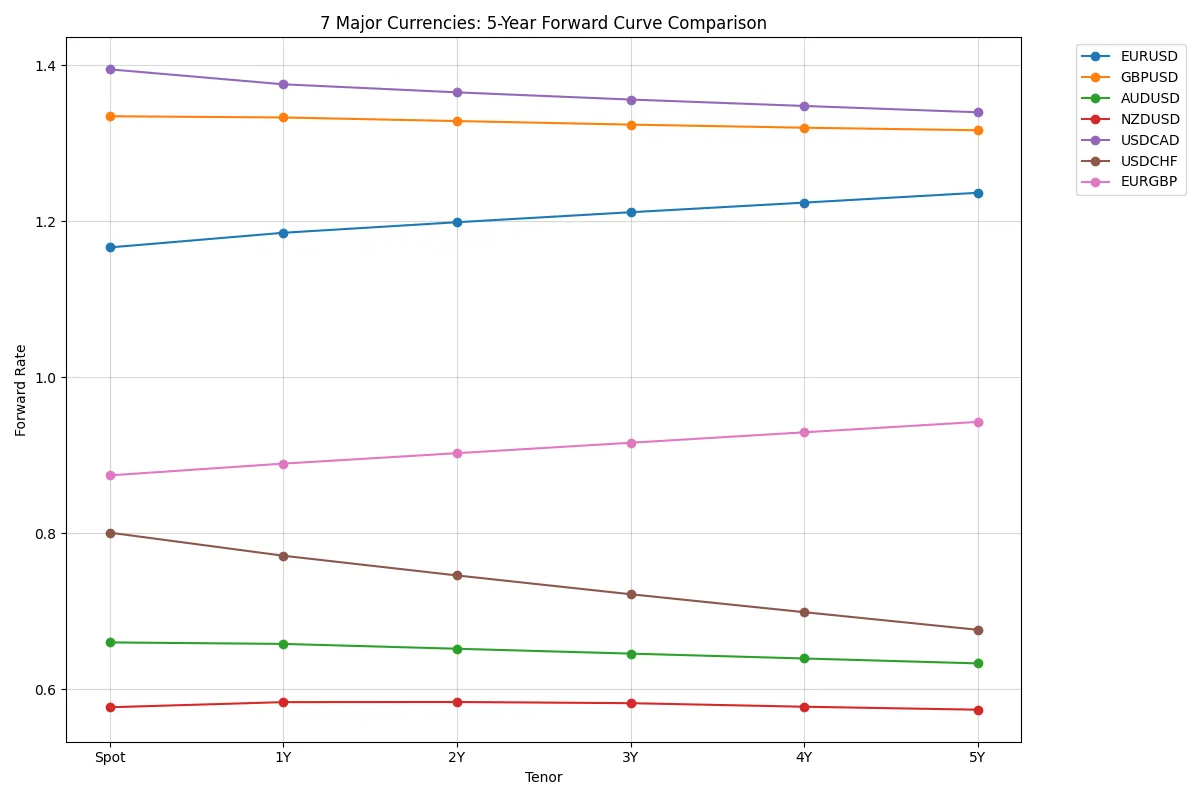
Interpreting the Forex Forward Curves
| Pattern | Meaning |
|---|---|
| Steep upward slope | Large interest rate differential — the base currency is expected to appreciate. |
| Steep downward slope | The quote currency has higher interest rates — the base currency is expected to depreciate. |
| Contango | An upward-sloping curve indicating a positive cost of carry. |
| Backwardation | A downward-sloping curve, typically reflecting negative carry or short-term supply stress. |
The API returns standardised JSON for every pair, from majors to emerging markets, so the same code works universally.
Ready to start pulling the Forex Forward Curve via API? Request API access to get your API key and integrate real-time forward curves today.
Related guides:
- Getting Forward Interest Rates — Interest rate forward rates
- Getting a Forward Curve — Interest rate forward curves
- API Reference — Full FX endpoint documentation