The yield curve is one of the most watched indicators in financial markets. Its shape tells you what the market thinks about growth, inflation, and where rates are headed.
The yield curve is a graph that plots the yields of bonds with the same credit quality across different maturities. The most widely referenced yield curve is the US Treasury curve, which shows government bond yields from the shortest maturities (treasury bills at one month) through to 30 years.
The shape of the yield curve reflects the market's collective expectations about future interest rates, inflation, and economic growth. It is one of the most important indicators in fixed-income markets and has direct implications for borrowing costs, hedging strategy, and investment allocation.
This guide covers the main yield curve shapes, what they signal, and how they affect corporate hedging decisions.
The Current Yield Curve
| Tenor | US Treasury Yield | SOFR Swap Rate | Swap Spread |
|---|---|---|---|
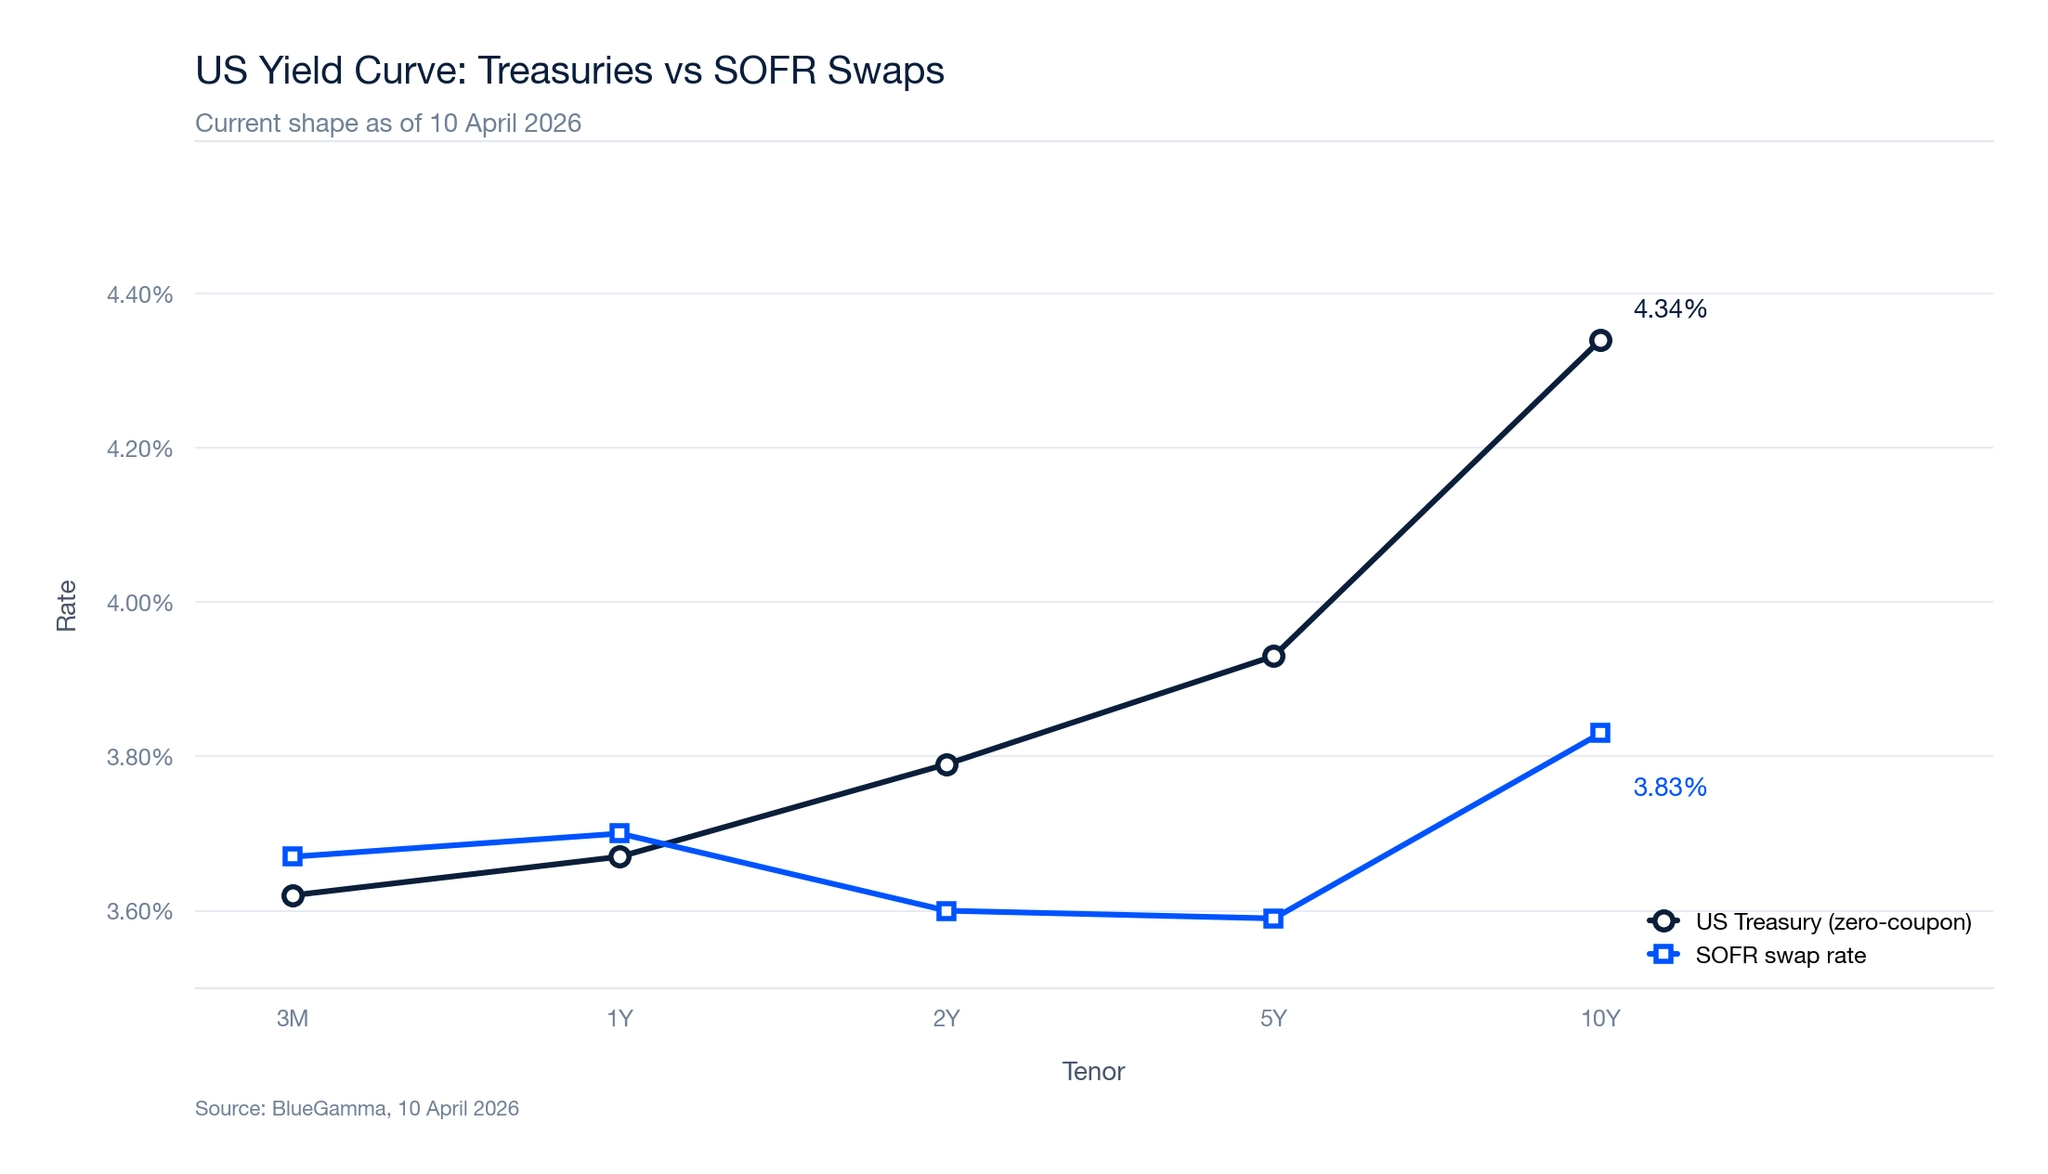
| 3M | 3.62% | 3.67% | +5 bps |
| 1Y | 3.67% | 3.70% | +3 bps |
| 2Y | 3.79% | 3.60% | -19 bps |
| 5Y | 3.93% | 3.59% | -34 bps |
| 10Y | 4.34% | 3.83% | -51 bps |
Source: BlueGamma, 9 April 2026.
The current US Treasury curve is upward-sloping (normal), with yields rising from 3.62% at 3 months to 4.34% at 10 years, a spread of 72 basis points. The SOFR swap curve shows a different shape, dipping at the 2-5 year point before rising at the long end. The divergence between Treasury yields and swap rates (the swap spread) reflects supply-demand dynamics in each market.
The Four Main Yield Curve Shapes
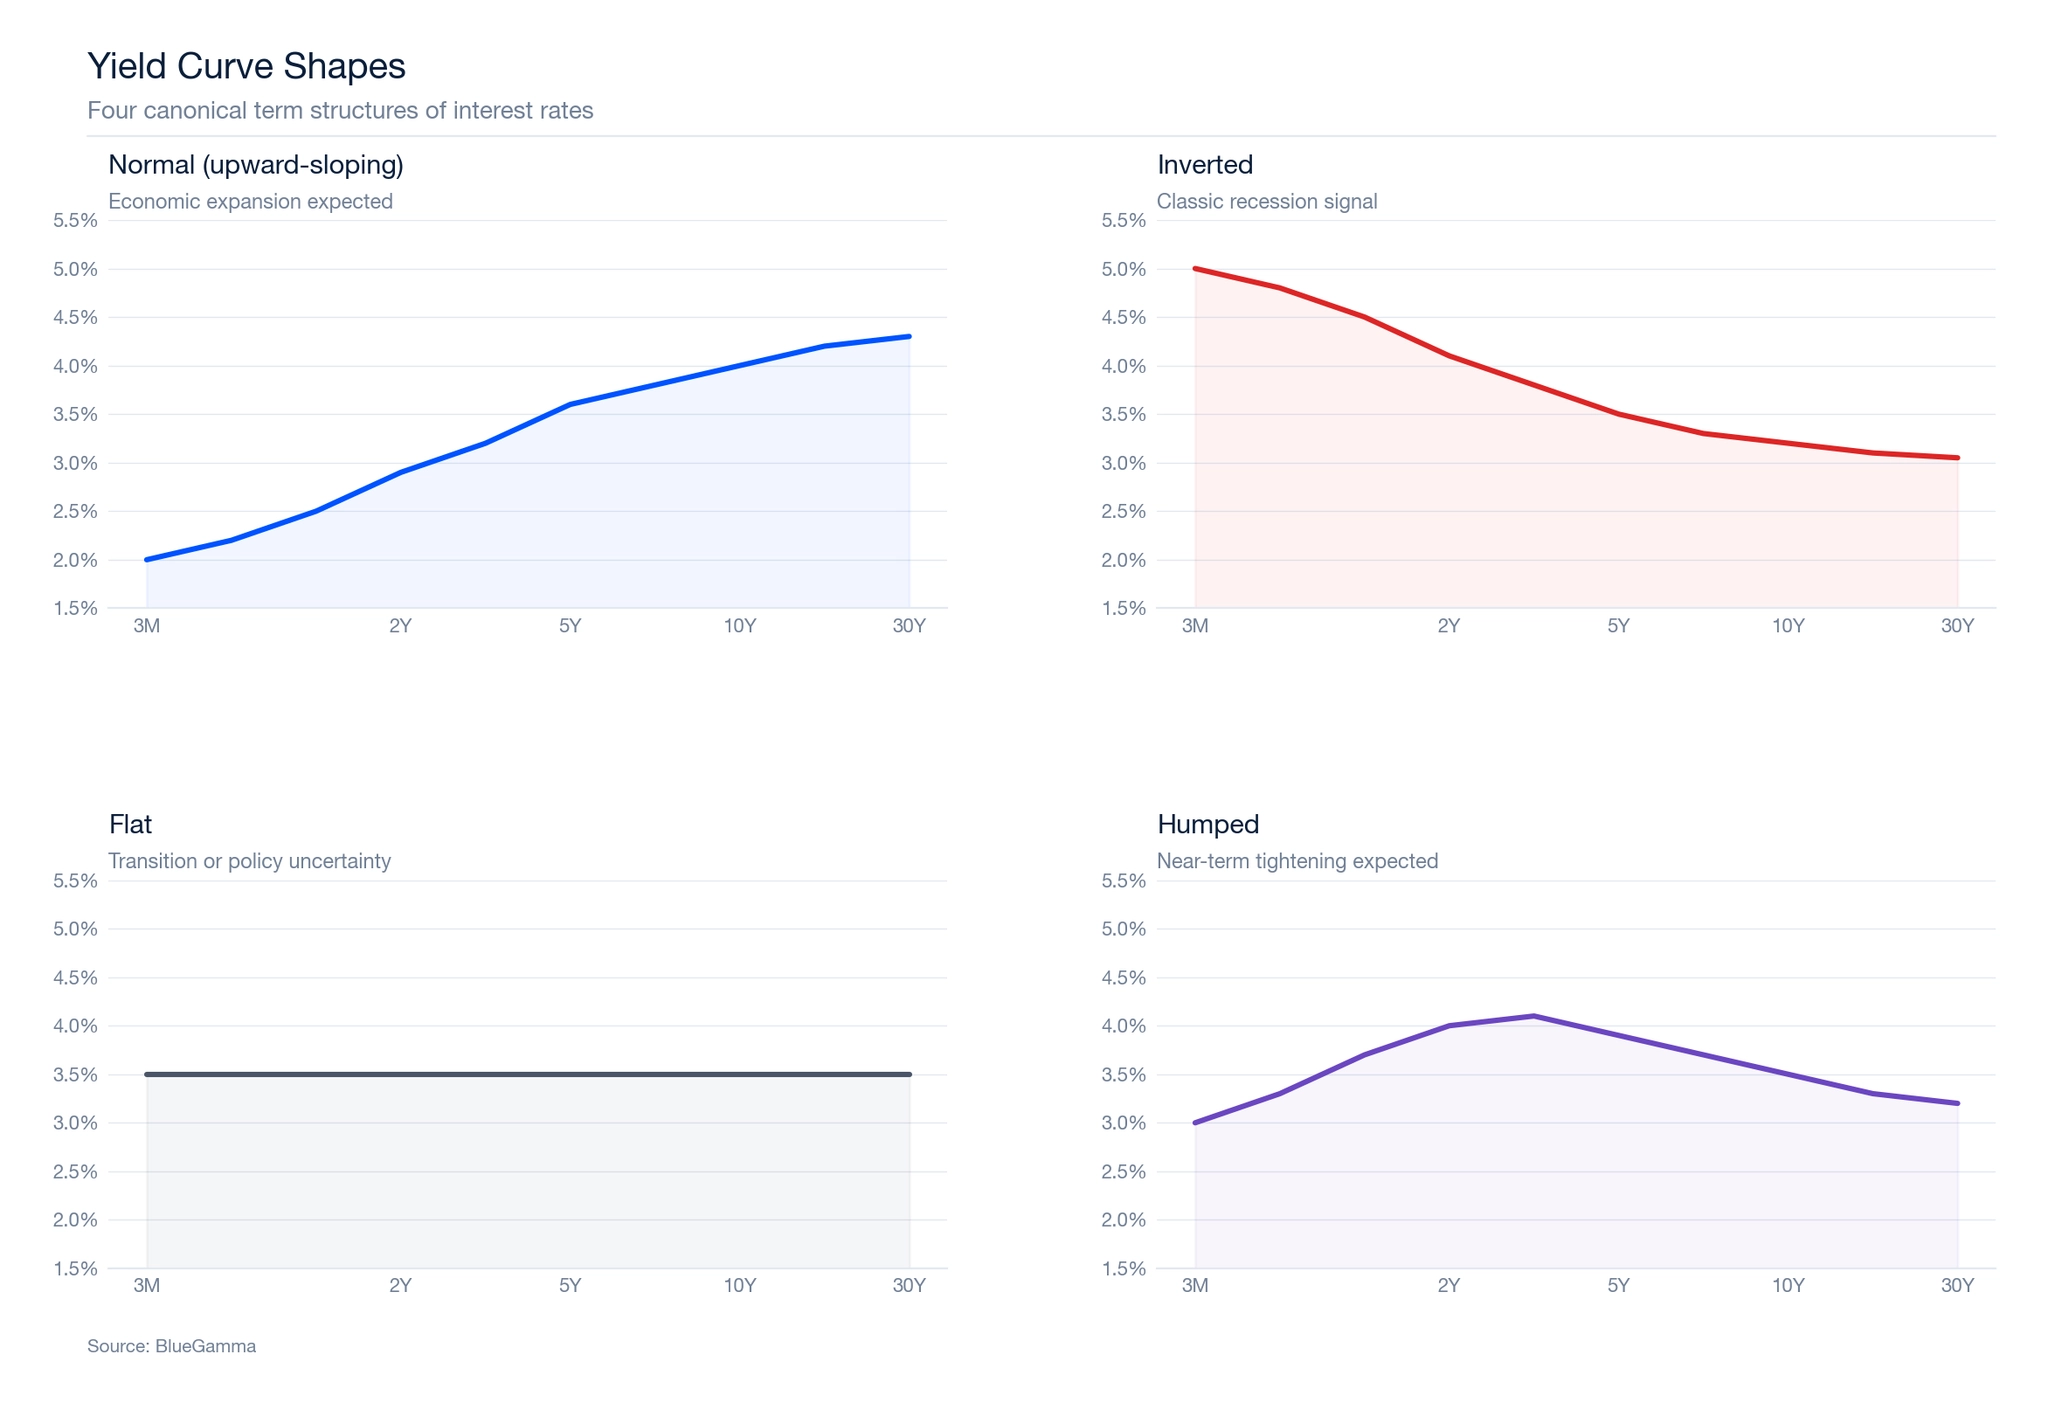
1. Normal (Upward-Sloping)
In a normal yield curve, longer-maturity bonds yield more than shorter-maturity bonds. This is the most common shape and reflects two economic realities:
- Term premium. Investors demand higher compensation for lending over longer periods, reflecting greater uncertainty about inflation and interest rates.
- Growth expectations. Markets expect economic expansion, which typically leads to higher future interest rates.
A normal curve is generally associated with healthy economic conditions and accommodative or neutral monetary policy.
Hedging implication: Borrowers locking in long-term fixed rates via swaps will pay a higher rate than the current short-term floating rate. The decision to fix depends on whether the term premium is justified by the borrower's need for certainty.
2. Inverted
An inverted yield curve occurs when short-term yields exceed long-term yields. This is a historically reliable signal of economic slowdown or recession.
Inversion typically occurs when:
- Central banks have raised short-term rates aggressively to combat inflation
- Markets expect rate cuts in the future as economic conditions weaken
- Demand for long-dated safe assets increases (pushing long yields down)
The US Treasury 2-year/10-year spread has inverted before every US recession since the 1970s, though the lead time typically varies from roughly 6 months to 24 months.
Hedging implication: In an inverted environment, fixing via a swap may actually reduce borrowing costs relative to the current floating rate, since the swap rate (which reflects expected future rates) may be lower than the current short-term rate.
3. Flat
A flat yield curve shows similar yields across all maturities. This shape often appears during transitions between normal and inverted curves and reflects uncertainty about the economic outlook.
Flat curves can also result from central bank intervention at the short end combined with strong demand for long-dated bonds.
Hedging implication: When the curve is flat, the cost of fixing (the swap rate) is similar to the current floating rate. This is often an attractive time to lock in fixed rates, as the term premium is minimal.
4. Humped (Bell-Shaped)
A humped curve occurs when medium-term yields are higher than both short-term and long-term yields. This is relatively uncommon and typically signals that markets expect near-term monetary tightening followed by an eventual reversal.
Hedging implication: Borrowers may find that medium-term swap rates are elevated relative to both shorter and longer tenors. Choosing a slightly longer or shorter hedge tenor can sometimes reduce the fixed rate.
The Inverted Yield Curve as a Recession Indicator
The inverted yield curve has one of the strongest track records of any recession indicator in financial markets. Every US recession since the mid-1970s has been preceded by an inversion of the 2-year/10-year Treasury spread (though the signal is imperfect: a brief 2s10s inversion in 1998 was not followed by a recession, and the deep 2022-23 inversion had not been followed by an NBER-dated recession through the end of 2025) (the "2s10s"). This includes the recessions of 1980, 1981-82, 1990-91, 2001, 2007-09, and 2020.
The most recent significant inversion occurred in 2022-2023, when the 2s10s spread reached approximately -109 basis points on 3 July 2023, the deepest inversion since the early 1980s. The curve remained inverted for over two years before normalising in late 2024. Despite the depth and duration of this inversion, the US economy avoided a technical recession through 2025, though growth slowed and credit conditions tightened materially.
The mechanism behind the yield curve inversion signal is well understood. When the Federal Reserve raises short-term rates aggressively through monetary policy tightening, short-term Treasury bill yields rise above long-term bond yields. This compresses bank lending margins (banks borrow short and lend long), reduces credit availability, and slows economic activity. Tighter monetary policy works with a lag, which explains the delay between inversion and recession.
The inverted yield curve has important limitations as a forecasting tool. The lead time between inversion and recession onset has ranged from 6 months to over 2 years, making precise timing unreliable. False signals have occurred, particularly outside the United States. The 2022-2023 episode demonstrated that structural factors (excess household savings, strong labour markets, fiscal stimulus) can delay or prevent the recessionary outcome that an inversion typically signals. Bond yields alone do not determine economic outcomes.
What Is Yield Curve Control?
Yield curve control (YCC) is a monetary policy tool in which a central bank targets a specific yield level for a particular government bond maturity, committing to buy or sell bonds as necessary to maintain that target. Unlike quantitative easing, which targets a quantity of bond purchases, YCC targets a price (yield).
The Bank of Japan implemented the most prominent example of yield curve control from September 2016 to March 2024, with the target band widening in stages from the initial near-zero reference to 50 basis points in December 2022, to an effective 100 basis points in July 2023, before the policy was formally abandoned, targeting the 10-year Japanese government bond (JGB) yield at around 0%. The target band was gradually widened from +/-0.25% to +/-1.0% before the policy was formally abandoned. YCC allowed the Bank of Japan to maintain ultra-low long-term rates while controlling the quantity of bond purchases.
The Federal Reserve discussed yield curve control during the COVID-19 crisis in 2020 but ultimately chose not to implement it, opting instead for large-scale asset purchases. Proponents argue that YCC provides more precise control over fixed income borrowing costs, while critics note the risk of unlimited balance sheet expansion if markets test the target.
Yield Curves Across Countries
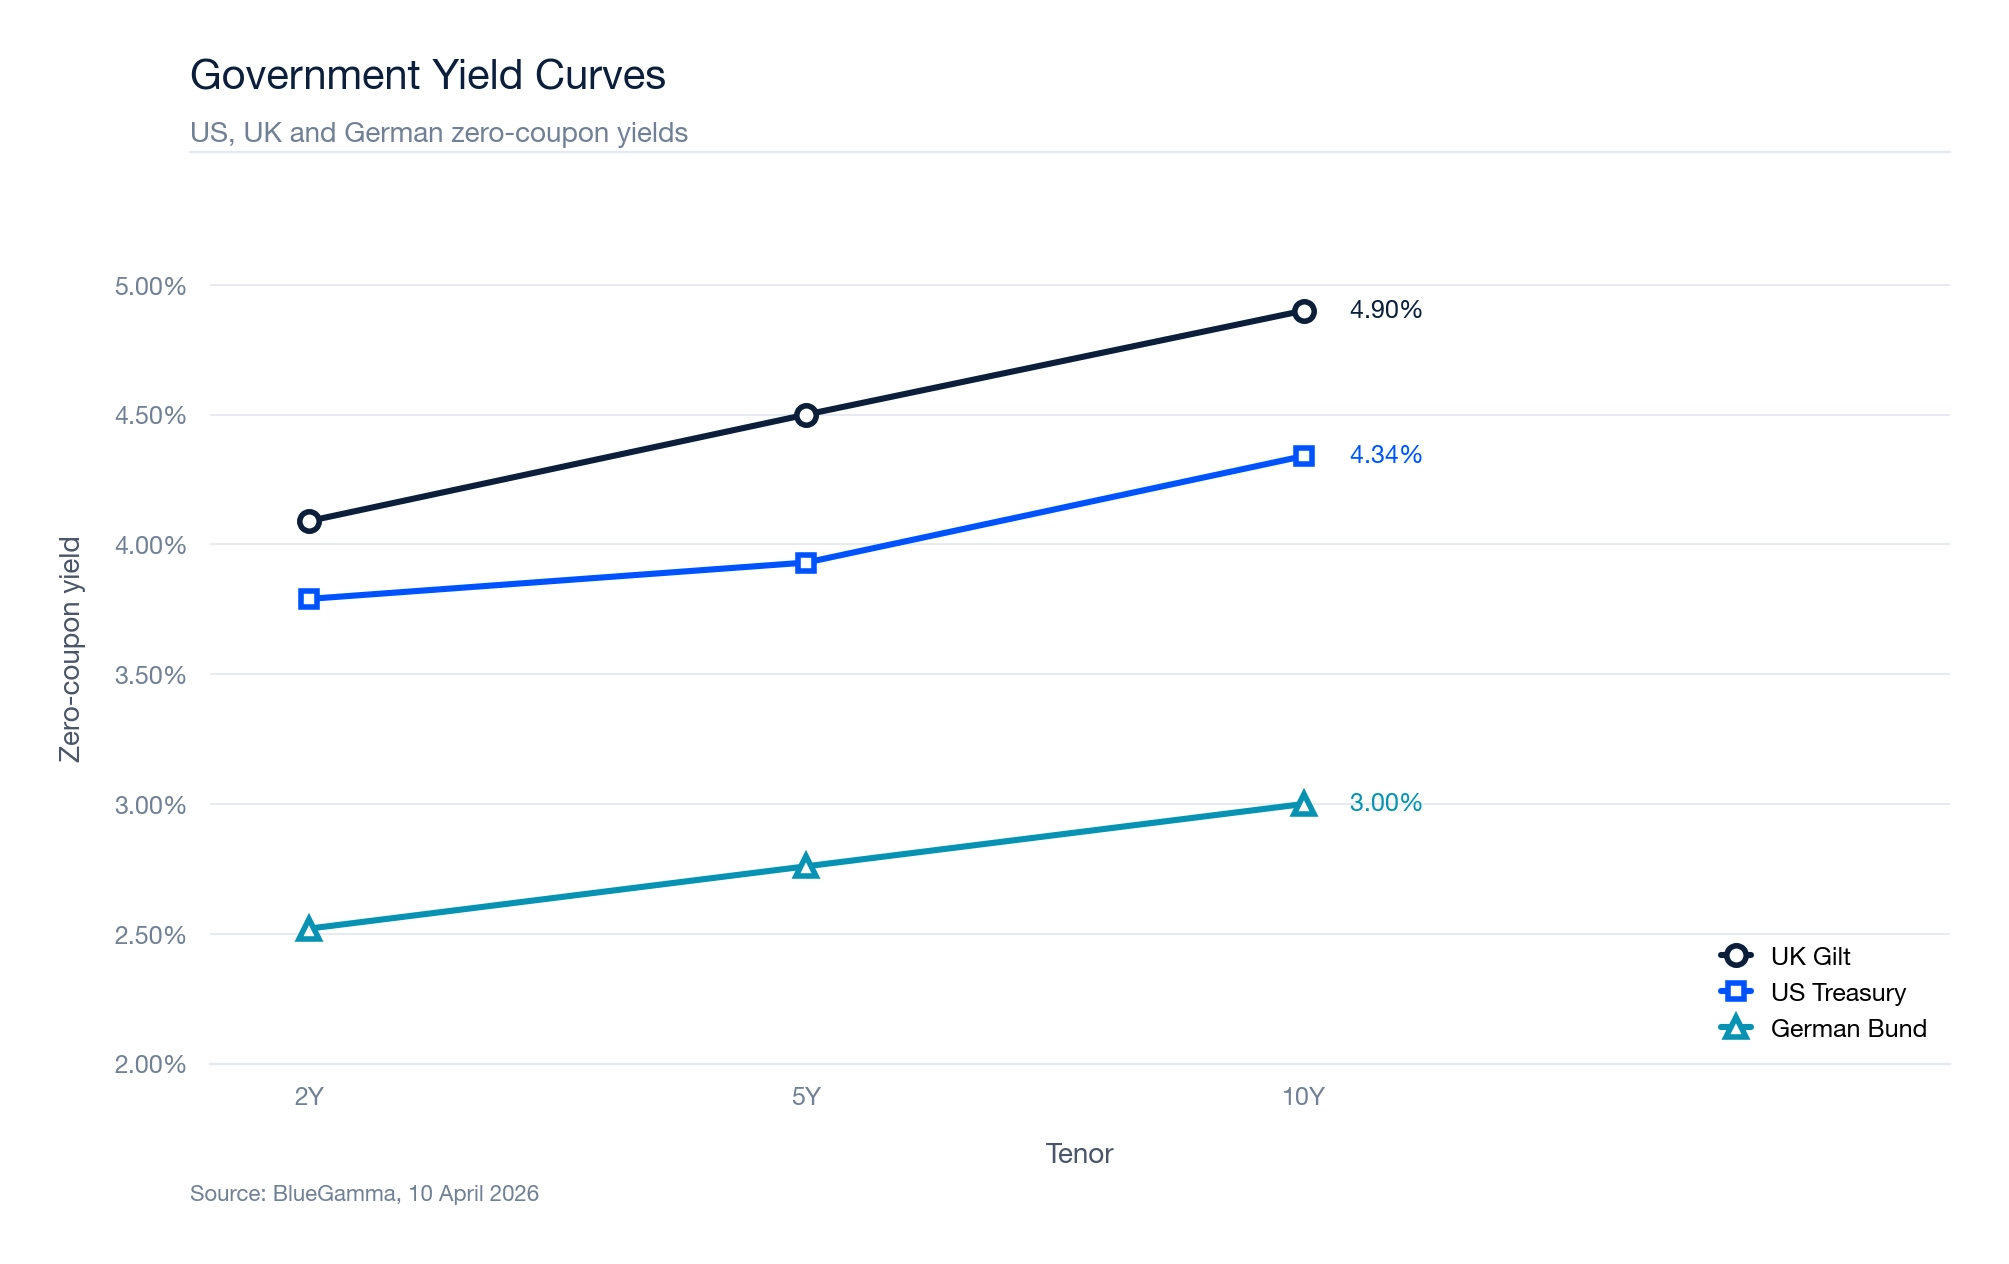
| Tenor | US Treasury | UK Gilt | German Bund |
|---|---|---|---|
| 2Y | 3.79% | 4.09% | 2.52% |
| 10Y | 4.34% | 4.90% | 3.00% |
| 2s10s Spread | 55 bps | 81 bps | 48 bps |
Source: BlueGamma, 9 April 2026.
All three curves are currently upward-sloping, though with different absolute levels reflecting each country's monetary policy stance and inflation outlook. UK Gilts show the steepest curve (81 bps 2s10s spread), while German Bunds are the flattest (48 bps) with the lowest absolute yields.
These differences are directly relevant for cross-currency hedging decisions. A European corporate borrowing in GBP will face a steeper term structure than one borrowing in EUR.
What Drives the Shape of the Yield Curve
Expectations theory
Forward rates embedded in the yield curve reflect market expectations of future short-term rates. If markets expect rates to rise, the curve slopes upward. If markets expect rate cuts, the curve inverts.
Term premium
Investors require additional compensation for holding longer-duration bonds, which carry more interest rate risk. This term premium pushes long-term yields above short-term yields, contributing to the normal upward slope.
Supply and demand
Government issuance patterns, central bank bond purchases (quantitative easing or tightening), pension fund liability-driven investment, and foreign investor demand all influence the supply-demand balance at different points of the curve.
Monetary policy
Central bank policy rates directly influence the short end of the curve. The long end is influenced by policy expectations and the factors above. The interaction between these forces determines the overall shape. Understanding curve shape is a critical input for derivative valuation, since discount factors derived from the curve determine the present value of future cash flows.
Implications for Hedging Strategy
The shape of the yield curve should inform, but not determine, hedging decisions:
Steep curve (normal): Fixing is more expensive relative to floating, but may be warranted if the borrower needs certainty. The forward curve implies rates will rise, consistent with the steep shape.
Flat curve: Fixing costs roughly the same as floating. This is often a good time to lock in, as the term premium is minimal.
Inverted curve: Fixing may actually reduce current costs. Markets are pricing in future rate declines. Borrowers who believe rates will stay elevated longer than the market expects may prefer to remain floating.
Humped curve: Consider adjusting the hedge tenor to avoid the peak. A 3-year or 7-year swap may be cheaper than a 5-year if the hump is at the 5-year point.
In all cases, the hedging decision should be driven by the borrower's risk management objectives rather than a speculative view on rates.
Summary
The yield curve is one of the most important references in financial markets. Its shape reflects market expectations about growth, inflation, and monetary policy. The four main shapes (normal, inverted, flat, and humped) each carry different implications for borrowing costs and hedging strategy.
The current US Treasury curve (9 April 2026) is upward-sloping, with yields rising from 3.62% at 3 months to 4.34% at 10 years. The SOFR swap curve shows a somewhat different profile, with a dip in the 2-5 year range before rising at the long end.
This article is for informational and educational purposes only and does not constitute financial, investment, legal, or tax advice. BlueGamma does not provide advisory services. Readers should consult qualified professional advisors before entering into any derivative transaction. Market data shown is indicative and sourced from BlueGamma as of the date stated.
Frequently Asked Questions
What is a yield curve?
A yield curve is a line that plots the interest rates (bond yields) of bonds with equal credit quality across different maturities, from short-term treasury bills to long-term government bonds. The US Treasury yield curve is the most widely referenced benchmark in fixed income markets and reflects the market's expectations for future interest rates, inflation, and economic growth.
What is an inverted yield curve?
An inverted yield curve occurs when short-term bond yields are higher than long-term bond yields. This inversion of the normal upward-sloping pattern typically results from aggressive central bank rate increases and signals that markets expect monetary policy easing (rate cuts) in the future. The inverted yield curve has preceded every US recession since the 1970s.
What does an inverted yield curve mean?
An inverted yield curve indicates that bond markets expect economic conditions to weaken, leading to lower interest rates in the future. The yield curve inversion compresses bank lending margins, tightens credit conditions, and historically has been followed by recession within 6 to 24 months. However, the timing is unreliable, and structural factors can delay or prevent the recessionary outcome.
Is the yield curve inverted right now?
As of 9 April 2026, the US Treasury yield curve is not inverted. The curve is upward-sloping (normal), with the 2-year yield at 3.79% and the 10-year yield at 4.34%, producing a positive 2s10s spread of 55 basis points. The curve normalised in late 2024 after a prolonged inversion during 2022-2023.
What is yield curve control?
Yield curve control (YCC) is a monetary policy tool where a central bank targets a specific yield level for a particular bond maturity, buying or selling bonds as needed to maintain that target. The Bank of Japan operated YCC from 2016 to 2024, targeting the 10-year JGB yield. The Federal Reserve has discussed but not implemented YCC.